Friday, January 18, 2013

More GBIF specimen identifier strangeness

Continuing the theme of trying to map specimens cited in the literature to the equivalent GBIF records, consider the GBIF record http://data.gbif.org/occurrences/685591320, which according to GBIF is specimen "ZFMK 188762" (a [sic] holotype of Praomys hartwigi).

This is odd, because the original publication of this name (Eisentraut, M. 1968 .Beitrag zur Saugetierfauna von Kamerun. Bonner Zoologische Beitraege, 19:1-14, see PDF below) gives the type (p. 11) as "Museum A. Koenig, Kat. Nr. 68. 7").


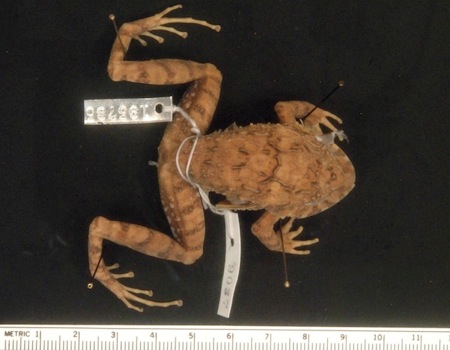
The GBIF record includes links to images of ZFMK 188762, such as http://www.biologie.uni-ulm.de/cgi-bin/imgobj.pl?sid=T&lang=e&id=102323.

Bild pl

If we open this link we see that specimen is listed as "ZFMK-68.7", which matches the original description. "ZFMK-68.7" is a link to http://www.biologie.uni-ulm.de/cgi-bin/herbar.pl?herbid=188762&sid=T&lang=e, which is the record for this specimen in the SysTax database.

Note that this URL includes the number 188762, which is treated as the catalogue number by GBIF (i.e., "ZFMK 188762"). So, it seems that in the data provided by SysTax the primary key in that database (188762) has become the catalogue number in GBIF (I tried to verify this by clicking on the original provider message on the GBIF page but it failed to produce anything). This means any naive attempt to locate the specimen "ZFMK-68.7" in GBIF is going to fail because the harvesting and indexing as conflated a local primary key with the catalogue number that appears in publications that refer to this specimen.

Sometimes I think we are doing our level best to make retrieving data as hard as possible...

Thoughts on Mendeley and Elsevier


The rumour that Elsevier is buying Mendeley has been greeted with a mixture of horror, anger, peppered with a few congratulations, I told you so's, and touting for new customers:


Here's some probably worthless speculation to add to the mix. Disclosure: I use Mendeley to manage 100,000's of references, and use the API for various projects. I'm not paying customer (but I do pay for some Internet services such as DropBox, BackBlaze, and Spotify, so it's not that I won't pay, it's just that the service Mendeley charge for doesn't interest me). I've published in Elsevier journals (most recently a couple of papers that, thanks to the efforts of Paul Craze, editor of TREE, are "free" in the sense you can download the PDF for free), and I took part in the Elsevier Grand Challenge.

So, given that I'm suitably compromised, here are some thoughts.

Elsevier suck


Elsevier are big, ugly, and at the corporate level are doing things that actively make researchers angry (see The Cost of Knowledge).

Elsevier rocks


Elsevier are one of the most innovative science publishers around. They fund challenges, are investing heavily in interactive and semantic markup of papers (for example, interactive phylogenies), and have built an app ecosystem on their publishing platform.

Mendeley sucks


Mendeley is suffering some from serious failings, most of which could be addressed with sufficient resources. The API sucks, mostly because Mendeley themselves don't actually use it. The Desktop client communicates with Mendeley's database using a different protocol, hence the API lacks the functionality needed to make truly great apps on the platform. The algorithms Mendeley use to de-duplicate their catalogue are flawed, occasionally creating entirely fictional entries.

Mendeley rocks


The way Mendeley engineered the creation of a bibliographic database in the cloud is genius, as is their recognition that the object around which scientists will cluster is the article, not the author. They helped foster the altmetrics movement, and have a great presence on Twitter and at conferences (i.e., you can talk to actual people who write code).

What happens next?


Let's assume that Elsevier does, indeed, buy Mendeley, and wants to do interesting things with Mendeley, and that Mendeley doesn't become one of the many startups that have a successful "exit" for the founders but ends up dying in the bosom of a larger company. Here are some possibilities.

Mendeley becomes iTunes for papers


Forget the "Last.fm" of papers, what about the "iTunes of papers"?. Big publishers are facing a revolt over the cost of institutional subscriptions, and journals are increasingly irrelevant as aggregations. The literature that people read is widely scattered across different outlets. Journals are archaic in the same way that music albums are mostly a thing of the past, people mix and match singles.

In the recent fight between UC Davis and Nature, Nature estimated that "CDL will be paying roughly $0.56 per download". So, why not charge a buck a paper? Mendeley's web interface is practically crying out for a "BUY THIS PAPER" button. Under this model, Elsevier has an outlet for its content that doesn't force people to subscribe to large amounts of stuff they don't want. Mendeley could be used to establish a relationship directly with paying customers, rather than institutions.

Mendeley becomes the de facto measure of research impact


But combining Mendeley's readership data with citations, Elsevier could construct powerful measures of research impact, bringing altmetrics into the mainstream. Couple this with links to institutions, and Elsevier could provide universities with all the data they need to evaluate academic performance (gulp).

Mendeley becomes an authoring tool


Managing references and inserting citations into manuscripts is one of the basic tasks facing an academic author. Authoring tools are evolving in the direction of being online, and embedding more semantic markup (e.g., these are taxon names, this is a chemical compound, this is a statement of causality). In a sense reference lists are the one form of structured markup we are already familiar with. Why not build on that and create an authoring platform?

Mendeley becomes the focus of post-publication review


Publishers have failed to crack the problem of post-publication review. Several provide the ability for readers to comment on an article online, but this has failed to take off. I think this is because the sociology is wrong, if you want a conversation you need to go where the people are, not expect them to come to you. Given that people are bookmaking papers in Mendeley, the next step is to get them to comment, or aggregate their annotations (in the same way that Amazon's Kindle can show you passages that others have highlighted).

Interesting times...

Thursday, January 17, 2013

Tight versus loose coupling

Following on from my previous post bemoaning the lack of links between biodiversity data sets, it's worth looking at different ways we can build these links. Specifically, data can be tightly or loosely coupled.

Tight coupling


Tight coupling uses identifiers. A good example is bibliographic citation, where we state that one reference cites another by linking DOIs. This makes it easy to store these links in a database, such as the Open Citations project which is exploring citation networks base don data from PubMed Cenral. Tight coupling also makes it easy to aggregate information from multiple sources. For example, one database may record citations of a paper, another may record citations of GenBank sequences, a third may record publication of taxonomic names. If all three databases use the same identifiers for the same publications (e.g., DOIs) we can combine them and potentially discover new things (for example, we could answer the question "how many descriptions of new species include sequence data?").

Loose coupling


In part this post has been prompted by a discussion I've been having with Paul Murray (@PaulMurrayCbr on his blog. Paul has added COinS to pages in the Australian Faunal Directory (AFD). These are snippets of HTML that encode a bibliographic reference as an OpenURL, and which browser extensions such as OpenURL Referrer for Firefox and COinS 2 OpenURL for Chrome can convert into links.

I've mapped many of the references in AFD to standard identifiers such as DOIs, or to digital libraries such as BioStor, and this tightly-coupled mapping is available in AFD on CouchDB. To date these mappings haven't been imported into AFD itself, which means that users of the original site don't have easy access to the literature that appears on that site (basically they'll have to Google each reference). However, if they have a browser extension (or the Javascript bookmarklet available from http://iphylo.org/~rpage/afd/openurl) that supports COinS, they will now see a clickable link that, in many cases, will take them to the online version of the corresponding reference.

This is an example of loose linking. The AFD site provides OpenURL links which can be resolved "just in time". Users of the AFD site can get some of the benefits of the tight linking stored in my CouchDB version of AFD, but the maintainers of AFD itself don't need to add code to handle these identifiers.

A lot of linking of biodiversity data shares this pattern. Instead of linking identifiers, one site links to another through a query. For example, NCBI taxonomy links to GBIF using URLs of the form "http://data.gbif.org/search/<taxon name>". Linking by query is potentially more robust than simply linking by URLs, especially if the target of the link doesn't ensure its identifiers are stable (GBIF, I'm looking at you). But there may be multiple ways to construct the same search query, which makes them poor candidates for use as identifiers. COinS are perhaps an extreme example, where there are at least two versions of the OpenURL standard in the wild, and the key-value pairs that make up the query can be in any order.

If the goal is to integrate data then having the same identifiers for the same thing make life a lot simpler, and means that we can switch from endless data cleaning and matching ("is this citation the same as that one?") to building systems that can tackle some of the scientific questions we are interested in. But in their absence we are left a kind of defensive programming where we expect the links to fail. Loose linking creates "soft links" that may work for humans (we get to click on a link and, with luck, see a web page) but they are less useful for mechanised tools trying to aggregate data.

When tight=loose


Although I've distinguished between tight and loose coupling, the distinction is not absolute. Indeed, one could argue that the best "tight" coupling is a form of "loose" coupling. For example, the most obvious form of tight linking is to use URLs for the things of interest. This is simple and direct, but has draw backs for both publisher and consumer. For the consumer, we are now at the mercy of the publisher's ability to keep the URLs stable. If they change (for example, publishing firm is bought by another firm, or adopts new publishing platform which generates different URLs) then the links break (not to mention that URLs for some resources, such as articles, are often conditional on how you are accessing the article, and may contain extraneous cruff such as session ids, etc.).

Likewise, the publisher is now constrained by a decision it made at the time of publication. If it decides to adopt better technology, or if circumstances otherwise change, it may find itself having to break existing identifiers. Some of this can be avoided if we designed clean URLs, such as this example http://data.rbge.org.uk/herb/E00001195 given by Roger Hyam. However, I wonder how persistent the ".uk" part of this URL will be if the Royal Botanic Garden Edinburgh finds itself in a Scotland that is no longer part of the United Kingdom.

One solution is our old friend indirection, where we put an identifier in between the consumer and the actual URL of the resource, and the consumer uses that identifier. This is the rationale for DOIs. The user gets an identifier that is unlikely to change, and hence can build systems upon that identifier. The publisher knows that they can change how they serve the corresponding data without disrupting their users, so long as they update the URL that the DOI points to. Indirection gives users the appearance of tight coupling without imposing the constraints of tight coupling on publishers.

Wednesday, January 16, 2013

Megascience platforms for biodiversity information: what's wrong with this picture?

The journal Mycokeys has published the following paper:

Triebel, D., Hagedorn, G., & Rambold, G. (2012). An appraisal of megascience platforms for biodiversity information. MycoKeys, 5(0), 45–63. doi:10.3897/mycokeys.5.4302

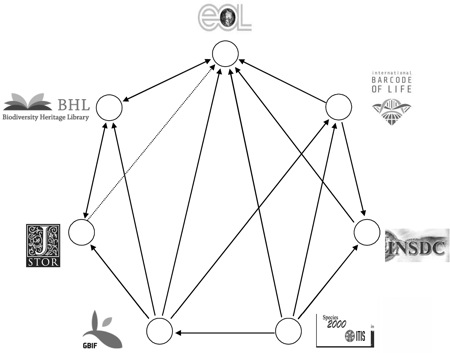
This paper contains a diagram that seems innocuous enough but which I find worrying:

MycoKeys 005 045 g001

The nodes in the graph are "biodiversity megascience platforms", the edges are "cross-linkages and data exchange". What bothers me is that if you view biodiversity informatics through this lens then the relationships among these projects becomes the focus. Not the data, not the users, nor the questions we are trying to tackle. It is all about relationships between projects.

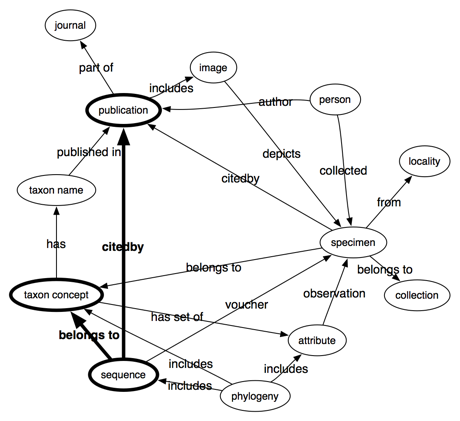
I want a different view of the landscape. For example, below is a very crude graph of the kinds of things I think about, namely kinds of data and their interrelationship:

Biodiversity

What tends to happen is that this data landscape gets carved up by different projects, so we get separate databases of taxonomic names, images, publications, and specimens (these are the "megascience platforms" such as CoL, EOL, GBIF). This takes care of the nodes, but what about the edges, the links between the data? Typically what happens is lots of energy is expended on what to call these links, in other words, the development of the vocabularies and ontologies such as those curated by TDWG. This is all valuable work, but this doesn't tackle what for me is the real obstacle to progress, which is creating the links themselves. Where are the "megascience platforms" devoted to linking stuff together?

When we do have links between different kinds of data these tend to be within databases. For example, Genbank explicitly links sequences to publications in PubMed, and taxa in the NCBI taxonomy database. All three (sequence, publication, taxon) have identifiers (accession number, PubMed id, taxon id, respectively) that are widely used outside GenBank (and, indeed, are the de facto identifiers for the bioinformatics community). Part of the reason these identifiers are so widely used is because GenBank is the only real "megascience platform" in the list studied by Triebel et al. It's the only one that we can readily do science with (think BLAST searches, think of the number of databases that have repurposed GenBank data, or build on NCBI services).

Genbank

Many of the questions we might ask can be formulated as paths through a diagram like the one above. For example, if I want to do phylogeography, then I want the path phylogeny -> sequence -> specimen -> locality. If I'm lucky the phylogeny is in a database and all the sequences have been georeferenced, but often the phylogeny isn't readily available digitally, I need to map the OTUs in the tree to sequences, I then need to track down the vouchers for those sequences, and obtain the localities for those sequences from, say, GBIF. Each step involves some degree of pain as we try and map identifiers from one database to those in another.

Phylogeography

If I want to do classical alpha taxonomy I need information on taxonomic names, concepts, publications, attributes, and specimens. The digital links between these are tenuous at best (where are the links between GBIF specimen records and the publications that cite those specimens, for example?).

Taxonomy

Focussing on so-called "platforms" is unfortunate, in my opinion, because it means that we focus on data and how we carve up responsibility for managing it (never mind what happens to data that lacks an obvious constituency). The platforms aren't what we should be focussing on, it is the relationships between data (and no, these are not the same as the relationships between the "platforms").

If I'd like to see one thing in biodiversity informatics in 2013 it is the emergence of a "platform" that makes the links the centre of their efforts. Because without the links we are not building "platforms", we are building silos.

Tuesday, January 15, 2013

iDigBio: You are putting identifiers on the wrong thing

LogoThe Integrated Digitized Biocollections (iDigBio) project aims to advance digitising US biodiversity collections. They recently published a GUID Guide for Data Providers. In the PDF document I read this:
It has been agreed by the iDigBio community that the identifier represents the digital record (database record) of the specimen not the specimen itself. Unlike the barcode that would be on the physical specimen, for instance, the GUID uniquely represents the digital record only. (emphasis added)

My heart sank. There's nothing wrong with having identifiers for metadata (apart from inviting the death spiral that is metadata about metadata), but surely the key to integrating specimens with other biodiversity data is to have globally unique identifiers for the specimens.

Now, identifiers for metadata can be useful. For example, there is a specimen of Parathemisto japonica in the National Museum of Natural History, Smithsonian Institution with the label "USNM 100988". The NMNH web site has a picture of the index card for this specimen:

Search php

This is an image of the metadata, not the specimen itself. We could link the metadata to this image, but of course we also want to link it to the actual specimen.

Specimens are the things we collect, preserve, dissect, measure, sequence, photograph, and so on. I want to link a specimen to the sequences that have been obtains from that specimen, I want to list the publications that cite that specimen, I want to be able to aggregate data on a specimen from multiple sources, I want to be able to add annotations including misidentifications, simple typos, or missing georeferencing.

Key to this is having identifiers for specimens. Identifiers for metadata about those specimens is not good enough. By analogy with bibliographic citation, one of the important decisions CrossRef made was that DOIs for articles identify the article, not the metadata about the article, or any of the different formats (HTML, PDF, print) and article may occur in. This means we can build databases about things and relationships (this article cites that one, these articles were authored by this person, etc.).

As it stands, if we don't have identifiers for specimens then we can't link data together. For example, the frog specimen "USNM 195785" is depicted in the image below (from EOL):

89351 orig

It is also listed in various papers in BioStor. In the absence of a globally unique identifier for this specimen how do I make these links? "USNM 195785" won't do because there are at least four specimens in the USNM with the catalogue number "195785". The GBIF occurrence id for this specimen (http://data.gbif.org/occurrences/244405570) would be an obvious candidate, were it not for the fact that GBIF has no concept of stable identifiers and its occurrence ids regularly change.

I confess I'm flabbergasted that iDigBio has avoid tackling the issue of specimen identifiers. If any museum wants to discover how its collection is being used to support science it will want to find the citations of its specimens in scientific papers and databases. This requires identifiers for specimens.

Friday, December 07, 2012

Elsevier articles have interactive phylogenies

Elsevier treeSay what you will about Elsevier, they are certainly exploring ways to re-imagine the scientific article. In a comment on an earlier post Fabian Schreiber pointed out that Elsevier have released an app to display phylogenies in articles they publish. The app is based on jsPhyloSVGand is described here. You can see live examples in these articles:

Matos-Maraví, P. F., Peña, C., Willmott, K. R., Freitas, A. V. L., & Wahlberg, N. (2013). Systematics and evolutionary history of butterflies in the “Taygetis clade” (Nymphalidae: Satyrinae: Euptychiina): Towards a better understanding of Neotropical biogeography. Molecular Phylogenetics and Evolution, 66(1), 54–68. doi:10.1016/j.ympev.2012.09.005
Poćwierz-Kotus, A., BurzyÅ„ski, A., & Wenne, R. (2010). Identification of a Tc1-like transposon integration site in the genome of the flounder (Platichthys flesus): A novel use of an inverse PCR method. Marine Genomics, 3(1), 45–50. doi:10.1016/j.margen.2010.03.001
Sampleimg2Sampleimg3

Thursday, December 06, 2012

NEXUS parser and tree viewer in Javascript

Following on from the SVG experiments I've started to put some of the Javascript code for displaying phylogenies on Github. Not a repository yet, but as gists, little snippets of code. Mike Bostock has created http://bl.ocks.org/ which makes it possible to host gists as working examples, so you can play with the code "live".

The first gist takes a Newick tree, parses it and displays a tree. You can try it at https://bl.ocks.org/d/4224658/.

The second gist takes a basic NEXUS file containing a TREES block and displays a tree (try it at http://bl.ocks.org/d/4229068/ ). You can grab examples NEXUS tree files from TreeBASE such as tree Tr57874.

NexusWhy am I doing this?
Apart from "because it's fun" there are two reasons. The first is that I want a simple way to display phylogenetic trees in web pages, and doing this entirely in the web browser (Javascript parses the tree and renders it in SVG) saves me having to code this on my server. Being able to do this in the browser opens up the opportunity to embed tree descriptions in HTML, for example, and have the browser render the tree. This means the same web page can have machine-readable data (the tree description) but also generate a nice tree for the reader. As an aside, it also shows that TreeBASE could display perfectly good, interactive trees without resorting to a Java appelet.

The other reason is that the web seems to be moving to Javascript as the default language, and JSON as the standard data format. Instead of large chunks of "middleware" (written in a scripting language such as Perl, PHP, or, gack, Java) which is responsible for talking to databases on the server and sending static HTML to the web browser, we now have browsers that can support sophisticated, interactive interfaces built using HTML and Javascript. On the server side we have databases that speak HTTP (essentially removing the need for middleware), store JSON, and use Javascript as their programming language (e.g., CouchDB). In short, it's Javascript, Javascript, everywhere.

Wednesday, December 05, 2012

The Tree of Life

The following poem by David Maddison was published in Systematic Biology (doi:10.1093/sysbio/sys057) under a CC-BY-NC license.

I think that I shall never see
A thing so awesome as the Tree
That links us all in paths of genes
Down into depths of time unseen;

Whose many branches spreading wide
House wondrous creatures of the tide,
Ocean deep and mountain tall,
Darkened cave and waterfall.

Among the branches we may find
Creatures there of every kind,
From microbe small to redwood vast,
From fungus slow to cheetah fast.

As glaciers move, strikes asteroid
A branch may vanish in the void:
At Permian's end and Tertiary's door,
The Tree was shaken to its core.

The leaves that fall are trapped in time
Beneath cold sheets of sand and lime;
But new leaves sprout as mountains rise,
Breathing life anew 'neath future skies.

On one branch the leaves burst forth:
A jointed limb of firework growth.
With inordinate fondness for splitting lines,
Armored beetles formed myriad kinds.

Wandering there among the leaves,
In awe of variants Time conceived,
We ponder the shape of branching fates,
And elusive origins of their traits.

Three billion years the Tree has grown
From replicators' first seed sown
To branches rich with progeny:
The wonder of phylogeny.

Tuesday, December 04, 2012

Viewing phylogenies on the web: Javascript conversion of Newick tree to SVG

Quick test of an idea I'm playing with. By embedding a Newick-format tree description in HTML and adding some Javascript I can go from this:
<div class="newick" data-drawing-type="circlephylogram">((((((((219923430:0.046474,219923429:0.009145):0.037428,219923426:0.038397):0.015434,(219923419:0.022612,219923420:0.015561):0.050529):0.004828,(207366059:0.020922,207366058:0.016958):0.038734):0.003901,219923422:0.072942):0.005414,((219923443:0.038239,219923444:0.025617):0.037592,(219923423:0.056081,219923421:0.055808):0.003788):0.009743):0.001299,(219923469:0.072965,125629132:0.044638):0.012516):0.011647,(((((219923464:0.069894,((((((125628927:0.021470,219923456:0.021406):0.003083,219923455:0.021625):0.029147,219923428:0.042785):0.001234,225685777:0.037478):0.016027,((((56549933:0.003265,219923453:-0.000859):0.015462,150371743:0.009558):0.004969,219923452:0.014401):0.024398,((((((150371732:0.001735,((150371733:0,150371736:0):6.195e-05,150371735:-6.195e-05):7.410e-05):0.000580,150371734:0.001196):0.000767,(150371737:0.001274,(150371738:0,150371740:0):0.000551):0.000498):0.000905,70608555:0.003205):0.004807,150371741:0.010751):8.979e-05,150371739:0.006647):0.022090):0.012809):0.011838,219923427:0.057366):0.009364):0.004238,((219923450:0.022699,125628925:0.012519):0.048088,219923466:0.046514):0.003608):0.007025,((56549930:0.067920,219923440:0.059754):0.002384,((219923438:0.044329,219923439:0.038470):0.014514,(219923442:0.038021,(((207366060:0,207366061:0):0.001859,125628920:0.001806):0.024716,((((125628921:0.005610,207366057:0.003531):0.001354,(207366055:0.003311,207366056:0.002174):0.003225):0.011836,207366062:0.019303):0.003741,((((((207366047:0,207366048:0):0,207366049:0):0.001563,207366050:0.000272):0.002214,(207366051:0.000818,125628919:0.001017):0.000675):0.003916,207366054:0.007924):0.004138,((219923441:0.000975,207366052:-0.000975):0.000494,207366053:-0.000494):0.012373):0.010040):0.003349):0.017594):0.011029):-0.003134):0.011235):0.004149,((((219923435:0.064354,219923424:0.067340):0.002972,219923454:0.045087):0.002092,((219923460:0.027282,219923465:0.025756):0.031269,(219923462:0.017555,219923425:-0.009591):0.047358):0.006198):0.004242,(((219923463:0.031885,(219923459:0.000452,219923458:-0.000452):0.029292):0.005200,225685776:0.024691):0.020131,219923461:0.042563):0.004673):0.009128):0.001452,((56549934:0.088142,56549929:0.066475):0.004212,(219923437:0.048313,219923436:0.044997):0.014553):0.008927):0);</div>
...to this (you will need an SVG-capable browser to see anything). The Javascript parses the Newick tree, generates SVG, then replaces the Newick tree in the HTML with the corresponding picture. No need for server-side graphics, the diagram is generated by your web browser based on the Newick tree description.
((((((((219923430:0.046474,219923429:0.009145):0.037428,219923426:0.038397):0.015434,(219923419:0.022612,219923420:0.015561):0.050529):0.004828,(207366059:0.020922,207366058:0.016958):0.038734):0.003901,219923422:0.072942):0.005414,((219923443:0.038239,219923444:0.025617):0.037592,(219923423:0.056081,219923421:0.055808):0.003788):0.009743):0.001299,(219923469:0.072965,125629132:0.044638):0.012516):0.011647,(((((219923464:0.069894,((((((125628927:0.021470,219923456:0.021406):0.003083,219923455:0.021625):0.029147,219923428:0.042785):0.001234,225685777:0.037478):0.016027,((((56549933:0.003265,219923453:-0.000859):0.015462,150371743:0.009558):0.004969,219923452:0.014401):0.024398,((((((150371732:0.001735,((150371733:0,150371736:0):6.195e-05,150371735:-6.195e-05):7.410e-05):0.000580,150371734:0.001196):0.000767,(150371737:0.001274,(150371738:0,150371740:0):0.000551):0.000498):0.000905,70608555:0.003205):0.004807,150371741:0.010751):8.979e-05,150371739:0.006647):0.022090):0.012809):0.011838,219923427:0.057366):0.009364):0.004238,((219923450:0.022699,125628925:0.012519):0.048088,219923466:0.046514):0.003608):0.007025,((56549930:0.067920,219923440:0.059754):0.002384,((219923438:0.044329,219923439:0.038470):0.014514,(219923442:0.038021,(((207366060:0,207366061:0):0.001859,125628920:0.001806):0.024716,((((125628921:0.005610,207366057:0.003531):0.001354,(207366055:0.003311,207366056:0.002174):0.003225):0.011836,207366062:0.019303):0.003741,((((((207366047:0,207366048:0):0,207366049:0):0.001563,207366050:0.000272):0.002214,(207366051:0.000818,125628919:0.001017):0.000675):0.003916,207366054:0.007924):0.004138,((219923441:0.000975,207366052:-0.000975):0.000494,207366053:-0.000494):0.012373):0.010040):0.003349):0.017594):0.011029):-0.003134):0.011235):0.004149,((((219923435:0.064354,219923424:0.067340):0.002972,219923454:0.045087):0.002092,((219923460:0.027282,219923465:0.025756):0.031269,(219923462:0.017555,219923425:-0.009591):0.047358):0.006198):0.004242,(((219923463:0.031885,(219923459:0.000452,219923458:-0.000452):0.029292):0.005200,225685776:0.024691):0.020131,219923461:0.042563):0.004673):0.009128):0.001452,((56549934:0.088142,56549929:0.066475):0.004212,(219923437:0.048313,219923436:0.044997):0.014553):0.008927):0);
Here's the same tree as a phylogram:
((((((((219923430:0.046474,219923429:0.009145):0.037428,219923426:0.038397):0.015434,(219923419:0.022612,219923420:0.015561):0.050529):0.004828,(207366059:0.020922,207366058:0.016958):0.038734):0.003901,219923422:0.072942):0.005414,((219923443:0.038239,219923444:0.025617):0.037592,(219923423:0.056081,219923421:0.055808):0.003788):0.009743):0.001299,(219923469:0.072965,125629132:0.044638):0.012516):0.011647,(((((219923464:0.069894,((((((125628927:0.021470,219923456:0.021406):0.003083,219923455:0.021625):0.029147,219923428:0.042785):0.001234,225685777:0.037478):0.016027,((((56549933:0.003265,219923453:-0.000859):0.015462,150371743:0.009558):0.004969,219923452:0.014401):0.024398,((((((150371732:0.001735,((150371733:0,150371736:0):6.195e-05,150371735:-6.195e-05):7.410e-05):0.000580,150371734:0.001196):0.000767,(150371737:0.001274,(150371738:0,150371740:0):0.000551):0.000498):0.000905,70608555:0.003205):0.004807,150371741:0.010751):8.979e-05,150371739:0.006647):0.022090):0.012809):0.011838,219923427:0.057366):0.009364):0.004238,((219923450:0.022699,125628925:0.012519):0.048088,219923466:0.046514):0.003608):0.007025,((56549930:0.067920,219923440:0.059754):0.002384,((219923438:0.044329,219923439:0.038470):0.014514,(219923442:0.038021,(((207366060:0,207366061:0):0.001859,125628920:0.001806):0.024716,((((125628921:0.005610,207366057:0.003531):0.001354,(207366055:0.003311,207366056:0.002174):0.003225):0.011836,207366062:0.019303):0.003741,((((((207366047:0,207366048:0):0,207366049:0):0.001563,207366050:0.000272):0.002214,(207366051:0.000818,125628919:0.001017):0.000675):0.003916,207366054:0.007924):0.004138,((219923441:0.000975,207366052:-0.000975):0.000494,207366053:-0.000494):0.012373):0.010040):0.003349):0.017594):0.011029):-0.003134):0.011235):0.004149,((((219923435:0.064354,219923424:0.067340):0.002972,219923454:0.045087):0.002092,((219923460:0.027282,219923465:0.025756):0.031269,(219923462:0.017555,219923425:-0.009591):0.047358):0.006198):0.004242,(((219923463:0.031885,(219923459:0.000452,219923458:-0.000452):0.029292):0.005200,225685776:0.024691):0.020131,219923461:0.042563):0.004673):0.009128):0.001452,((56549934:0.088142,56549929:0.066475):0.004212,(219923437:0.048313,219923436:0.044997):0.014553):0.008927):0);

Wednesday, November 28, 2012

ZooBank data model

I'm trying to get my head around the data model used by ZooBank to store taxonomic names. To do this, I've built a graph for the species Belonoperca pylei described by Baldwin & Smith described in:
Baldwin, C. C., & Smith, W. L. (1998). Belonoperca pylei, a new species of seabass (Teleostei: Serranidae: Epinephelinae: Diploprionini) from the cook islands with comments on relationships among diploprionins. Ichthyological Research, 45(4), 325–339. doi:10.1007/BF02725185

After extracting some data from ZooBank API I created a DOT file connecting the various "taxon name usages" associated with Belonoperca pylei and constructed a graph using GraphViz:
Zoobank
You can grab the DOT file here, and a bigger version of the image is on Flickr. I've labelled taxon names and references with plain text as well as the UUIDs that serve as identifiers in ZooBank. (Update: the original diagram had Belonoperca pylei Baldwin & Smith, 1998 sensu Eschmeyer [9F53EF10-30EE-4445-A071-6112D998B09B] in the wrong place, which I've now fixed.)

This is a fairly simple case of a single species, but it's already starting to look a tad complicated. We have Belonoperca pylei Baldwin & Smith, 1998 linked to its original description (doi:10.1007/BF02725185) and to the genus Belonoperca Fowler & Bean, 1930 (linked to its original publication http://biostor.org/reference/105997) as interpreted by ("sensu") Baldwin & Smith, 1998. Belonoperca Fowler & Bean 1930 sensu Baldwin & Smith 1998 is linked to the original use of that genus (i.e., Belonoperca Fowler & Bean, 1930). Then we have the species Belonoperca pylei Baldwin & Smith, 1998 as understood in Eschmeyer's 2004 checklist.

Notice that each usage of a taxon name gets linked back to a previous usage, and names are linked to higher names in a taxonomic hierarchy. When the species Belonoperca pylei was described it was placed in the genus Belonoperca, when Belonoperca was described it was placed in the family Serranidae, and so on.

Tuesday, November 27, 2012

Fuzzy matching taxonomic names using ngrams

Quick note to self about possible way to using fuzzy matching when searching for taxonomic names. Now that I'm using Cloudant to host CouchDB databases (e.g., see BioStor in the the cloud) I'd like to have a way to support fuzzy matching so that if I type in a name and misspelt it, there's a reasonable chance I will still find that name. This is the "did you mean?" feature beloved by Google users. There are various ways to tackle this problem, and Tony Rees' TAXAMATCH is perhaps the best known solution.

Cloudant supports Lucence for full text searching, but while this allows some possibility for approximate matching (by appending "~" to the search string) initial experiments suggested it wasn't going to be terribly useful. What does seem to work is to use ngrams. As a crude example, here is a CouchDN view that converts a string (in this case a taxon name) to a series of trigrams (three letter strings) then indexes their concatenation.


{
"_id": "_design/taxonname",
"language": "javascript",
"indexes": {
"all": {
"index": "function(doc) { if (doc.docType == 'taxonName') { var n = doc.nameComplete.length; var ngrams = []; for (var i=0; i < n-2;i++) { var ngram = doc.nameComplete.charAt(i) + doc.nameComplete.charAt(i+1) + doc.nameComplete.charAt(i+2); ngrams.push(ngram); } if (n > 2) { ngrams.push('$' + doc.nameComplete.charAt(0) + doc.nameComplete.charAt(1)); ngrams.push(doc.nameComplete.charAt(n-2) + doc.nameComplete.charAt(n-1) + '$'); } ngrams.sort(); index(\"default\", ngrams.join(' '), {\"store\": \"yes\"}); } }"
}
}
}

To search this view for a name I then generate trigrams for the query string (e.g., "Pomatomix" becomes "$Po Pom oma mat ato tom omi mix ix$" where "$" signals the start or end of the string) and search on that. For example, append this string to the URL of the CouchDB database to search for "Pomatomix":


_design/taxonname/_search/all?q=$Po%20Pom%20oma%20mat%20ato%20tom%20omi%20mix%20ix$&include_docs=true&limit=10


Initial results are promising (searching on bigrams generated an alarming degree of matches that seemed rather dubious). I need to do some more work on this, but it might be a simple and quick way to support "did you mean?" for taxonomic names.

Thursday, November 22, 2012

BioStor in the cloud

CloudantQuick note on an experimental version of BioStor that is (mostly) hosted in the cloud. BioStor currently runs on a Mac Mini and uses MySQL as the database. For a number of reasons (it's running on a Mac Mini and my knowledge of optimising MySQL is limited) BioStor is struggling a bit. It's also gathered a lot of cruff as I've worked on ways to map article citations to the rather messy metadata in BHL.

So, I've started to play with a version that runs in the cloud using my favourite database, CouchDB. The data is hosted by Cloudant, which now provides full text search powered by Lucene. Essentially, I simply take article-level metadata from BioStor in BibJSON format and push that to Cloudant. I then wrote a simple wrapper around querying CouchDB, couple that with the Documentcloud Viewer to display articles and citeproc-js to format the citations (not exactly fun, but someone is bound to ask for them), and a we have a simple, searchable database of literature.

If you want to try the cloud-based version go to http://biostor-cloud.pagodabox.com/ (code on Github).

Bcloud

I've been wanting to do this for a while, partly because this is how I will implement my entry in EOL's computational data challenge, but also because CrossRef's Metadata search shows the power of finding references simply by using full text search (I've shamelessly borrowed some of the interface styling from Karl Ward's code). David Shorthouse demonstrates what you can do using CrossRef's tool in his post Conference Tweets in the Age of Information Overconsumption. Given how much time I spend trying to parse taxonomic citations and match them to articles in CrossRef's database, or BioStor, I'm looking forward to making this easier.

There are two major limitations of this cloud version of BioStor (aprt from the fact it has only a subset of the articles in BioStor). The first is that the page images are still being served from my Mac Mini, so they can be a bit slow to load. I've put the metadata and the search engine in the cloud, but not the images (we're talking a terabyte or two of bitmaps).

The other limitation is that there's no API. I hope to address this shortly, perhaps mimicking the CrossRef API so if one has code that talks to CrossRef it could just as easily talk to BioStor.

Wednesday, November 21, 2012

Species wait 21 years to be described - show me the data

21Benoît Fontaine et al. recently published a study concluding that average lag time between a species being discovered and subsequently described is 21 years.

Fontaine, B., Perrard, A., & Bouchet, P. (2012). 21 years of shelf life between discovery and description of new species. Current Biology, 22(22), R943–R944. doi:10.1016/j.cub.2012.10.029

The paper concludes:

With a biodiversity crisis that predicts massive extinctions and a shelf life that will continue to reach several decades, taxonomists will increasingly be describing from museum collections species that are already extinct in the wild, just as astronomers observe stars that vanished thousands of years ago.

This is a conclusion that merits more investigation, especially as the title of the paper suggests there is an appalling lack of efficiency (or resources) in the way we decsribe biodiversity. So, with interest I looked at the Supplemental Information for the data:

I was hoping to see the list of the 600 species chosen at random, the publication containing their original description, and the date of their first collection. Instead, all we have is a description of the methods for data collection and analysis. Where is the data? Without the data I have no way of exploring the conclusions, asking additional questions. For example, what is the distribution of date of specimen collection in each species? One could imagine situations where a number of specimens are recently collected, prompting recognition and description of a new species, and as part of that process rummaging through the collections turns up older, unrecognised members of that species. Indeed, if it takes a certain number of specimens to describe a species (people tend to frown upon descriptions based on single specimens) perhaps what we are seeing is the outcome of a sampling process where specimens of new species are rare, they take a while to accumulate in collections, and the distribution of collection dates will have a long tail.

These are the sort of questions we could have if we had the data, but the authors don't provide that. The worrying thing is that we are seeing a number of high-visibility papers that potentially have major implications for how we view the field of taxonomy but which don't publish their data. Another recent example is:

Joppa, L. N., Roberts, D. L., & Pimm, S. L. (2011). The population ecology and social behaviour of taxonomists. Trends in Ecology & Evolution, 26(11), 551–553. doi:10.1016/j.tree.2011.07.010

Biodiversity is a big data science, it's time we insisted on that data being made available.

Monday, October 22, 2012

Resolving free-form citations

Cms logoCrossRef have released CrossRef Metadata Search a nice tool that can take a free-form citation and return possible matches from CrossRef's database. If you get a match CrossRef can take the DOI and format for you it in a variety of styles using DOI content negotiation.

If, like me, you spend a lot of time trying to find DOIs (and other identifiers) for articles by first parsing citations into their component parts, then this is good news. It's also good news for publishers that may balk at one of CrossRef's requirements for joining its club: if you want DOIs for your articles it's not enough to submit metadata for your article, you also need to submit the list of references that article cites, including their DOIs. This requirement enables CrossRef to offer their "cited by" service, but imposes a burden on smaller journals operating on a tight budget (e.g., Zootaxa). With CrossRef Metadata Search you can just send author-supplied citation strings from the manuscript and have a good chance of finding the corresponding DOI, if it exists.

Of course, the service only works if the article has a DOI, so it's not a complete solution to being able to parse bibliographic citations into their component parts. But it's a nice model, and I'm tempted to apply the same approach to my databases, such as BioStor or my ever growing Mendeley library (which is larger than the Mendeley desktop client can easily handle). A quick way to do this would be to use Cloudant which has cloud-based CouchDB coupled with a Lucene-based fulltext search engine. If I've time I may try and put a demo together.

Friday, October 19, 2012

The failure of phylogeny databases


It is well known that phylogeny databases such as TreeBASE capture a small fraction of the published phylogenies. This raises the question of how to increase the number of trees that get archived. One approach is compulsion:


In other words:
  1. Databasing trees is the Right Thing™ to do
  2. Few people are doing the Right Thing™
  3. This is because those people are bad/misguided and must be made to see the light

I want to suggest an alternative explanation:
  1. It is not at all obvious that databasing trees is useful
  2. The databases we have suck
  3. There's no obvious incentive for the people producing trees to database them
Why do we need a database of trees?

That we don't have a decent, widely used database of trees suggests that the argument still has to be made. Way back in the mid 1990's when TreeBASE was first starting I was at Oxford University and Paul Harvey (coauthor of The Comparative Method in Evolutionary Biology) was sceptical of its merits. Given that the comparative method depends on phylogenies, and people like Andy Purvis were in the Harvey lab building supertrees (http://dx.doi.org/10.1098/rstb.1995.0078) this may seem odd (it certainly did to me) but Paul shared the view of many systematists. Phylogenies are labile, they change with increased data and taxon sampling, hence individual trees have a short life span.

Data, in contrast, is long-lived. You'd happily reuse GenBank sequences published a decade ago, you probably wouldn't use a decade-old phylogeny. I made this point in an earlier post about the data archive Dryad (Data matters but do data sets?). A problem facing packages of data (such as papers, data sets, and phylogenies) is that the package itself may be of limited interest, beyond reproducing earlier results and benchmarking. In the case of phylogenies, if someone has a tree ((a,b),c) and someone else has a tree ((d,e),f), it's not obvious that we can combine these. But if we have sequences for the same gene from the same six taxa we can build a larger tree, say (((a,d),(b,e)),(c,f)).

I think this is part of the reason why GenBank works. Yes, there is compulsion (it's very hard to publish on sequences if you haven't deposited the data in GenBank), but there are clear benefits of depositing data. As the database grows we can do bigger analyses. If you are trying to identify a species based on its DNA, the chances are that the nearest sequence will have been deposited by somebody else. By depositing data your work it also lasts longer than if people just had the paper (your tree is likely to be outdated, that sequence from a rare, hard to obtain species might be used for decades to come).

Note that I'm not saying a database of trees isn't a good idea, but there seems to be an assumption that it is so obvious that it doesn't need justification. Demonstrably this isn't the case. Maybe we should figure out what we'd want to do with such a database, then tackle how we'd make that possible. For example, I'd want to query a phylogeny database geographically (show me trees from this part of the globe), by ecological association (find the trees for any parasites on this clade), by temporal period (what clades originated in the Miocene?), by data (what trees used this sequence which we now know is chimeric?), by topology (have we settled on the sister group to snakes yet?), and so on. I would also argue that much of this is doable, but might not actually require archiving published phylogenies. Personally I think anybody tackling these questions would do well to use PhyLoTA as their starting point.

TreeBASE sucks

Yes, I'm as sick of saying this as you are of reading it. But it doesn't change the fact that just about everything about TreeBASE from the complexity of the underlying data model, the choice of programming language, the use of a Java applet to display trees, the Byzantine search interface, and the voluminous XML output make TreeBASE a bag of hurt. None of this would matter much if it was an indispensable part of people's research toolkit, but this isn't the case. If you are trying to convince people of the benefits of sharing trees you really want a tool that makes a it seem a no brainer. We aren't there yet.

The "fuck this" point

In a great post on the piracy threshold, Matt Gemmell argues that piracy is largely the fault of content providers because they make being honest too difficult. How many times have you wanted to buy something such as a book or a movie only to discover that the content provider doesn't sell it in your part of the world (e.g., in the iBooks store in the US but not the UK) or doesn't provide it in the media you want (e.g., DVD but not online)? To top it off every time you go to the movies you are subjected to emotional blackmail or threats of unlimited fines if you were to copy the movie you already paid to watch?

6892585935 32d4e21e77 o

I think databases have the same "fuck this" threshold. If you are asking people to submit data you want to make it as easy as possible. And you want at least some of the benefits to be immediate and obvious. Otherwise you are left with coercing people, and that's being, at best, lazy.

If you want an example of how to do it right, look at Mendeley's model. They want to build a public cloud of academic papers, a laudable goal, the Right Thing™ to do. But they sell the idea not as a public good, not as the Right Thing™, nor by trying to compel people (they can't, they're a private company). Instead they address a major point of pain - where the hell did I put that PDF? - and make it trivial to organise your collection of articles. Then they make it possible to back them up to the cloud, to view them on multiple devices, to share them, and viola, we get a huge database of publications. The sociology works. So, my question is, what would the equivalent be for phylogenetics?

Wednesday, October 17, 2012

OneZoom

6e1f1693ed5d70b2f495e9a2c8666114 reasonably smallJames Rosindell's OneZoom tree viewer is out and the paper describing the viewer has been published in PLoS One (disclosure, I was a reviewer):

Rosindell, J., & Harmon, L. J. (2012). OneZoom: A Fractal Explorer for the Tree of Life. PLoS Biology, 10(10), e1001406. doi:10.1371/journal.pbio.1001406.g004
Below is a video where James describes OneZoom.


OneZoom is fun, and is deservedly attracting a a lot of attention. But as visually striking as it is, I confess I have reservations about fractal-based viewers. For a start they make it hard to get a sense of the relative size of taxonomic groups. Looking at the mammal tree shown in the video above your eye is drawn to the monotremes, one of the smallest mammalian lineages. That the greatest number of extant mammals are either rodents or bats is not readily apparent. Fractal geometry also removes the timescale, so you can't discover whether radiations in different clades are the same age (unlike, say, if the tree was drawn in a "traditional" fashion with a linear timescale). In some ways I think fractal viewers are rather like the hyperbolic viewers that attracted attention about a decade ago - visually striking but ultimately difficult to interpret. What I'd like to see are studies which evaluate how easily people can navigate different trees and accomplish specific tasks (such as determining closest relationships, relative clade diversity, etc.).

HypviewerIn some ways OneZoom resembles Google Maps with its zoomable interface. But ironically this only serves to illustrate a key different between OneZoom and Google Maps. Part of the strength of the later is the consistent conventions for drawing maps (e.g., north is up, south is down) which, when coupled with agreed co-ordinates (latitude and longitude), enables people to mash up geographic data. What I'd like is the equivalent of CartoDB for trees.

Friday, October 12, 2012

Mapping evolutionary biology: @evoldir and #ProjectEvoMap

Robert M. Griffin (@GriffinEvo) has launched ProjectEvoMap. Rob explains:
I have decided this week to try to create a resource where evolutionary
biologists can find info on labs and groups from all around the world. I
have created a collaborative Google map online which evolutionary biology
research groups can pin their labs to with a brief description of their
interests. Others can then browse the map to look for labs in specific
areas – for example, if someone wants to find suitable labs in their
current country for work they can see all the labs in that area, likewise
anyone looking for work in a specific region or who needs access to labs
while on fieldwork can look for nearby groups which may be able to help.

Below is a screen shot of part of the map. If you're working on evolutionary biology now is your chance to literally put your lab on the map.

Project
In parallel I'm experimenting with adding a map to the venerable EvolDir mailing list, for which I run a twitter stream (@evoldir). Using some terribly crude code to extract what looks like an address from EvolDir posts, then calling Google's Geocoding API results in a map of recent posts. You can see the live map at http://bioguid.info/services/evoldir/. This service compliments Rob's by giving a sense of current activity in the community (e.g., conferences, courses, jobs).

Evoldir

Friday, September 28, 2012

Reading the Biodiversity Heritage Library using Readmill

Readmill reasonably smalltl;dr Readmill might be a great platform for shared annotation and correction of Biodiversity Heritage Library content.

Thinking about accessing the taxonomic literature I started revisiting previous ideas. One is DeepDyve (see DeepDyve - renting scientific articles). Imagine not having to pay large sums for an article, but being able to rent it. Yes, open access would be great, but ultimately it's all a question of money (who pays and when), the challenge is to find the mix of models that encourage people to digitise the relevant literature. Instead of publishers insisting we pay $US30 for an article, how about renting it for the short time we actually need to read it?

Another model is unglue.it, a Kickstarter-like company that seeks to raise funds to digitise and make freely available e-Books. unglue.it has campaigns where people pledge donations, and if sufficient pledges are made the book's rights-holder has the book digitised and released DRM-free.

Looking at unglue.it I stumbled across Readmill, "a curious community of readers, highlighting and sharing the books they love." Readmill has an iPad app where you can highlight passages of text and add your own annotation. These annotations can be shared, and multiple people can read and comment on the same book. Imagine doing this on BHL content. You could highlight parts of the text where the OCR has failed, and provide a correction. You could highlight taxonomic names that automatic parsers have missed, geographic localities, cited literature, etc. All within a nice, social app.

Even better, Readmill has an API. You can retrieve highlights and comments on those highlights. So, if someone flags a sentence as mangled OCR and provides a correction, that correction could be harvested and feed back to, say, BHL. These corrections could be used to improve searches, as well as the text delivered when generating searchable PDFs, etc.

You can even add highlights via the API, so we could upload a ePub book then add all the taxonomic names found by uBio or NetiNeti, enabling users to see which bits of text are probably names, correcting any mistakes along the way. Instead of giving readers a blank canvas they could already have annotations to start with.

Building an app from scratch to read and annotate BHL content would be a major undertaking. From my cursory initial look I wonder if Readmill might just provide the platform we need to clean up and annotate key parts of the BHL corpus?

Monday, September 24, 2012

Towards a biogeographic search engine

We all have a "past" that we might not advertise widely, and my past includes flirting with panbiogeography. Indeed my PhD thesis hdl:2292/1999 is entitled "Panbiogeography: a cladistic approach." Shortly after graduating I moved on to host-parasite cospeciation and the gene tree/species tree problem ("reconciled trees", see Katz et al. http://dx.doi.org/10.1093/sysbio/sys026 for a recent example of this approach), but part of me misses the glory days of vicariance, dispersal, and panbiogeography.

One thing which strikes me is how little use large-scale historical biogeography makes of GBIF data. One of the things that made Croizat's panbiogeography so interesting was the way he exposed similar distribution patterns in unrelated groups of organisms. He did this by hand, producing map after map, some embellished with all manner of annotations ("gates", "nodes", "massings", etc.). In some ways, Croizat as an early data miner. Now we are awash in distributional data, where are the people revisiting global scale historical patterns? In particular, wouldn't it be cool to have a biogeographic search engine that could pull out taxa with particular distribution patterns that we could then analyse.

For example, while working on a project to map taxonomic names to literature and genomics data, I embedded a widget to display GBIF maps. Every so often I come across taxa have the classic "Gondwana" distribution pattern. For example, below is a map for stoneflies of the family the Notonemouridae from GBIF.


Below is a map for the Notonemouridae using an orthographic projection (see earlier post for details):

Notonemouridae
Another family of stone flies, the Gripopterygidae, show a similar pattern:

Gripopterygidae

What I'd like is to be able to query a database like GBIF for patterns such as these Gondwanic distributions, then be able to pull out associated phylogenetic information (e.g., via sequences in GenBank) so that we could determine the antiquity of these patterns, and whether they are consistent with geological models. We could begin to do large-scale testing of biogeographic hypotheses in a (semi-)automated way. At present we generally rely on a few well-studied examples that are either broadly consistent with
Bocxlaer, I. V., Roelants, K., Biju, S. D., Nagaraju, J., & Bossuyt, F. (2006). Late Cretaceous Vicariance in Gondwanan Amphibians. (M. Hofreiter, Ed.)PLoS ONE, 1(1), e74. doi:10.1371/journal.pone.0000074.t002

or contradict
Cook, L. G., & Crisp, M. D. (2005). Not so ancient: the extant crown group of Nothofagus represents a post-Gondwanan radiation. Proceedings of the Royal Society B: Biological Sciences, 272(1580), 2535–2544. doi:10.1098/rspb.2005.3219

the hypothesis that the history of biota of the southern hemisphere has been largely structured by the break-up of Gondwana.

A first step might be to index distributions at, say, family level and above, and provide a series of polygons representing different distribution patterns. We then search for distributions that are largely concordant with those patterns, and query GenBank (or TreeBASE) for sequences (or phylogenies) for those taxa. We then ask the questions "how old are these taxa?" and "what biogeographic histories do they have?"

Saturday, September 22, 2012

Touching the tree of life

Prompted by a conversation with Vince Smith at the recent Online Taxonomy meeting at the Linnean Society in London I've been revisiting touch-based displays of large trees. There are a couple of really impressive examples of what can be done.

Perceptive Pixel


I've blogged about this before, but came across another video that better captures the excitement of touch-based navigation of a taxonomy. Perceptive Pixel's (recently acquired by Microsoft) Jeff Han demos browsing an animal classification. The underlying visualisation is fairly sttaightforward, but the speed and ease with which you can interact with it clearly makes it fun to use.

DeepTree


DeepTree comes from Life on Earth lab, and there's a paper coming out by @blockflorian and colleagues (I was reminded of this project by @treevisproject):


For technical details on the layout algorithm see https://lifeonearth.seas.harvard.edu/downloads/DeepTree.pdf. Below is a video of it in use:


Both of these are really nice, but what I really want is to have this on my iPad…