Showing posts with label timeline. Show all posts

Friday, December 23, 2016

Taxonomic name timelines for BHL

Given a big corpus of literature one of the fun things to do is look at how the use of a term has changed over time. When did people first use a particular word? When did one word start to replace another, etc.? Google's Ngram Viewer is perhaps the best known tool for exploring these questions.

In the context of biodiversity doing something similar for BHL is an obvious thing to do. I've made various clunky attempts in the past (e.g., Biodiversity Heritage Library sparklines) but these all died.

Ryan Schenk (who did a lot of the user interface for my BioNames project) wrote a very stylish tool to display changes in names over time. Called "Synynyms" his tool is now defunct, but you can read about it here and the source code is on github. Ryan would take a name, find synonyms, then graph the changes in use of all those names over time.

Bison bison Linnaeus 1758 synynyms 1024x675

The death of Synynyms has not gone unnoticed:

I've had a tool for my own use that searches BHL for a name and displays the results after first trying to aggregate the hits in a sensible way. For example, if there is more than one hit in a scanned volume, and those hits al fall on pages in the same article in BioStor, then I display the BioStor article, instead of a list of each hit separately. Inspired by @PhyloJCAM's question I've built a simple tool to explore the use of one or more name over time.

Located in the "labs" section of BioStor, the BHL timeline takes one or more names and searches for those names in BHL, displaying the results as a chart and a list of hits. I often use it simply to search BHL for a particular name, but you can also use it to compare names, e.g. Aspidoscelis costata and Cnemidophorus costatus:

Screenshot 2016 12 23 06 38 32

The timeline tool is pretty crude, and it's slow if there are lots of hits in BHL. So, it's not as slick as Synynyms (Ryan Schenk is a clever programmer than I am). Still, it is a useful way to explore BHL and discover articles that you might not have known existed.

Thursday, August 15, 2013

BioNames update - taxonomic name timelines

One feature I've always wanted to have in BioNames is a timeline of taxonomic names. ION has one (see here), but I wanted a way to go from the timeline to the actual publications. In other words, if, say, there were approximately 99 bird names published in 2012, I want to see the papers that published those names.

As an example, you can go to http://bionames.org/timeline/Animalia/Chordata/Vertebrata/Aves and get a timeline of bird names:
Birds
The data is incomplete (I'm still processing and indexing the data) but you get a sense that the number of bird names being coined each year is fairly small. Actually, I was surprised it was as high as it is, but remember these are not the number of new species described each year. It does include new species (many of them are fossils in this case), but also higher taxa and nomenclatural changes (e.g., replacement names for homonyms, etc.). The timeline also only shows names that are "new" (i.e., not the new combinations that result when a species gets moved to a new genus), and only those names linked to a publication.

The timeline graphs are clickable, so you can click on a year and get a list of publications for that taxon for that year (sometimes this can take a while). You can click on the publications for more details, sometimes you can also view the full text.

The timeline page also shows a treemap of the taxonomic groups recognised by the ION database (the example below is for birds):

Treemap

Browsing different taxa shows some interesting patterns. For example, here are snakes:

Snakes
That huge spike on the far right? That's due to hundreds of names published by "Snake Man" Raymond Hoser (his activities have been the subject of an impassioned debate on TAXACOM).

The timeline for insects shows a major dip in new names that corresponds to the Second World War, followed by a big jump in the late sixties.

Insects

Smaller taxa, such as Teuthida, show a more episodic pattern where a single monograph can result in a prominent spike in the numbers in any one year (again, you can click on the spikes to see the actual publications):

Squid

Still a daunting mount of cleaning and linking to do, but it's one more way to explore the efforts of generations of taxonomists to discover and make sense of the diversity of animal life on the planet.


Friday, October 02, 2009

Biodiversity Heritage Library sparklines

Time for a quick and dirty Friday afternoon hack. Based on responses to the BHL timeline I released two days ago, I've created a version that can compare the history of two names using sparklines (created using Google's Chart API). I use sparklines to give a quick summary of hits over time (grouped by decade).

The demo is here. It's crude (minimal error checking, no progress bars while it talks to BHL), but it's home time. As an example, here is a screen shot comparing the occurrences in BHL for two rival names for the sperm whale, Physeter catodon and Physeter macrocephalus:
physeter.png

There is a link to the full timeline for each of these names so you can investigate more. Note that the sparklines will be heavily biased by BHL coverage, but it may yield some interesting insights into the history of the usage of a name.

Wednesday, September 30, 2009

Visualising the Biodiversity Heritage Library as a Timeline

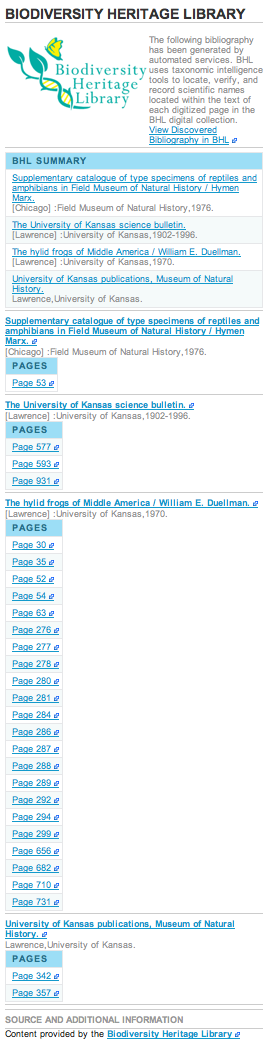
bhlstrip.pngOne thing about the Encyclopedia of Life which bugs me no end is the awful way it displays the bibliography generated from the Biodiversity Heritage Library (BHL). The image on the right shows the bibliography for the frog Hyla rivularis Taylor, 1952. It's one long, alphabetical list of pages. How can a user make sense of this? It's even more annoying because the BHL is one of the cornerstones of EOL, and one could argue that BHL content is one of the few thing pages EOL offer that distinguishes them from cheap and cheerful mashups such as iSpecies. Can't we do something a little better?

BHL has an API (documented here), so I decided to experiment. As I mentioned in an earlier post (Biodiversity Heritage Library, Google books, and metadata quality), a key piece of metadata about a bibliographic reference is its date. This is especially so for the taxonomic literature, where the earliest reference that contains a name may (depending on how complete BHL scanning is) be the first description of that name. So, it would be nice to order the BHL bibliography by date. Turns out it's possible to get dates from quite a few BHL items, providing one fusses with regular expressions long enough.

So, in principle we could sort BHL content by dates. But, we could go one better and visualise them. As an experiment, I've put together a demo that uses the SIMILE Timeline widget to display the BHL bibliography for a taxon. Here's a screenshot of the bibliography for Hyla rivularis:
bhltimeline.png


You can generate others at http://bioguid.info/bhl/. The demo has been thrown together in haste, but here's what it does:
  1. Takes a taxon name and tries to find it in uBio. This gives us the NamebankID BHL needs
  2. Calls the BHL API and retrieves the bibliography for the NamebankID found in step 1
  3. Parses the BHL result, trying to extract dates (often the dates are ranges, e.g. 1950-1955)
  4. The previous step generates a JSON document which can be displayed by Timeline

If you click on an item you get a list of pages, clicking on any those takes to you to the page in BHL. Items that have a range of dates are displayed as horizontal lines, items with a well-defined date are shown as points. Note that my code for working out the date of an item will probably fail on some items, and some items don't have any dates at all. Hence, not every item in BHL will appear in the timeline.

It would be nice to embellish the results a little (for example, group pages into articles, refine the dates, etc.) but I think this goes a little way to demonstrating what can be done. We could also add articles obtained from other sources (e.g., Google Scholar, PubMed) to the same display, providing an overview of published knowledge about a taxon.