Showing posts with label classification. Show all posts

Monday, June 08, 2020

Towards visualising classifications from Wikidata

These are simply notes to myself about taxonomic classifications in Wikidata.

Classifications in Wikidata can be complex and are often not trees. For example, if we trace the parents of the frog family Leptodactylidae back we get a graph like this:


Each oval represents a taxon in Wikidata, and each arrow connects a taxon to its parent(s) in Wikidata.  Likewise, if we do the same for the albatross genus Diomedea we get a similarly complex diagram:


The presence of multiple classifications likely reflects several factors. If you deal with just extant species you are likely to have fairly shallow classifications, for example, the kingdom, phylum, class, order, family, genus ranks used by GBIF. may be enough. Some taxonomic groups may routinely use ranks such as subfamily, and in well-studied groups there may be additional taxa based on phylogenetic research (e.g., the RTA clade in spiders). And of course, different Wikidata editors may favour different classifications.

Anecdotally (certainly for vertebrates), many of the additional levels in the classifications in Wikidata come from fossil taxa. In the case of birds, extant Aves (birds) are a fairly isolated group in the tree of life, but as we go down the tree towards their common ancestor with the crocodilians we encounter dinosaurs and other taxa. So if you are a palaeontologist the jump from, say Aves to Tetrapoda skips over a fairly significant part of the tree!

Faced with this complexity, how do we display a Wikidata classification in a simple way? One approach may be to display only a classification from a particular source, for example Mammal Species of the World. This requires that Wikidata has that classification, and enough information for you to extract it by a SPARQL query (for example if each node in the classification that is in MSW has a reference to MSW attached to that node).

Another approach is to extract a simplified classification from the sort of graphs shown above. Technically, these graphs are DAGs (Directed acyclic graphs). An obvious way to simplify a DAG is to find the shortest path in that DAG. For example, the path (Eukaryota, Animalia, Bilateria, Deuterostomia, Chordata, Olfactores, Gnathostomata, Tetrapoda, Amphibia, Anura, Leptodactylidae) is a path through the DAG shown above. Shortest paths are reasonably easy to find once you have a topological sorting of the graph (see e.g. Shortest Path in Directed Acyclic Graph). At the moment this looks the best bet for displaying classifications from Wikidata.

Preferred classifications

In some cases the classification in Wikidata is complicated, but this complexity isn’t reflected in SPARQL results because parts of that classification have different “ranks”. For example, for the plant order Fagales there are currently seven parents:
  • fabids
  • Rosanae
  • Hamamelididae
  • eurosids I
  • Monochlamydeae
  • Archichlamydeae
  • Juglandanae
One of these is flagged “Preferred rank” (fabids) and the others are “Normal rank”. As a result only the rabies appear in the list of parents.

Saturday, January 14, 2017

Displaying taxonomic classifications from Wikidata using d3js and SPARQL

Sahelanthropus tchadensis TM 266 01 060 1 Following on from previous posts The Semantic Web made fun: d3sparql and The Biodiversity Heritage Library meets Wikidata via Wikispecies: adding author identifiers to BioStor I've put together an example query that can be used to extract a taxonomic classification from Wikidata. The query is inspired by the http://biohackathon.org/d3sparql/ example, and uses the wikidata property P171 ("parent taxon") which is subproperty of rdfs:subClassOf (the property used in the d3sparql example which queries the Uniprot taxonomy).

The following SPARQL query generates a list of nodes in the tree representing the classification of Hominini (humans, chimps, and their extinct relatives):

PREFIX wdt: <http://www.wikidata.org/prop/direct/>
PREFIX wd: <http://www.wikidata.org/entity/>
SELECT ?root_name ?parent_name ?child_name WHERE
{
 VALUES ?root_name {"Hominini"}
 ?root wdt:P225 ?root_name .
 ?child wdt:P171+ ?root .
 ?child wdt:P171 ?parent .
 ?child wdt:P225 ?child_name .
 ?parent wdt:P225 ?parent_name .
}

Using https://query.wikidata.org/sparql as the endpoint, in http://biohackathon.org/d3sparql/ this generates the following diagram:

Screenshot 2017 01 14 11 41 55

There are some obvious issues with this classification, such as genera that lack descendant species (e.g., Cyphanthropus). Indeed, we could imagine developing SPARQL queries to flag up such errors (see A use case for RDF in taxonomy). But the availability and accessibility of Wikidata and its SPARQL interface makes it a great playground to explore the utility of SPARQL for exploring taxonomic data.

Monday, March 03, 2014

GBIF liverwort taxonomy broken

Lunularia cruciataA quick note to myself to document a problem with the GBIF classification of liverworts (I've created issue POR-1879 for this).

While building a new tool to browse GBIF data I ran into a problem that the taxon "Jungermanniales" popped up in two different places in the GBIF classification, which broke a graphical display widget I was using.

If you search GBIF for Jungermanniales you get two results, both listed as "accepted":
Jungermanniales

Plantae > Marchantiophyta > Jungermanniopsida

Jungermanniales

Plantae > Bryophyta > Jungermanniopsida

Based on Wikipedia pages for
Marchantiophyta, traditionally liverworts such as the Jungermanniales were included in the Bryophyta, but are now placed in the Marchantiophyta. The GBIF classification has both the old and the new placement for liverworts (sigh).

As an aside, I couldn't figure out why Wikipedia gave the following as the reference for the publication of the name "Marchantiophyta":
Stotler, R., & Crandall-Stotler, B. (1977). A Checklist of the Liverworts and Hornworts of North America. The Bryologist. JSTOR. doi:10.2307/3242017

This paper doesn't mention "Marchantiophyta" anywhere. The other authority Wikipedia gives is:
Crandall-Stotler, B., Stotler, R. E., Long, D. G., & Goffinet, B. (2001). Morphology and classification of the Marchantiophyta. (A. J. Shaw, Ed.)Bryophyte Biology. Cambridge University Press. doi:10.1017/cbo9780511754807.002

which is behind a paywall that my University doesn't subscribe too. However, the following reference
Stotler, R., & Crandall-Stotler, B. (2008). Correct Author Citations for Some Upper Rank Names of Liverworts (Marchantiophyta). Taxon, 57(1):289-292. jstor:25065970

states that:

Marchantiophyta was validly published (Crandall Stotler & Stotler, 2000) by reference to the Latin description of Hepatophyta in Stotler & Crandall-Stotler (1977:425), a designation formed from an illegitimate generic name, Hepatica Adans. non Mill, and hence not validly published under Article 16.1, cross-referenced in Article 32.1(c) of the ICBN (McNeill & al, 2006). Marchantiophyta phylum nov. is redundant in Doweld (2001) who established a later isonym by likewise citing the Latin description in Stotler & Crandall-Stotler (1977) for his proposed "new name."

And who said taxonomy couldn't be fun?

Wednesday, August 14, 2013

Cluster maps, papaya plots, and the trouble with GBIF taxonomy

Continuing the theme of the failings of the GBIF classification I've been playing further with cluster maps to visualise the problem (see this earlier post for an introduction).

Browsing through bats in GBIF I keep finding the same species appearing more than once, albeit in different genera. As discussed in the gibbon example, GBIF merges several competing classifications for mammals, and these often don't agree on the "accepted name" for a species. In the absence of a decent database of taxonomic synonyms, GBIF ends up duplicating species, and each duplicate is often associated with different occurence data. If you are trying to get the distribution for a species this can be a disaster.

To get a sense of the scale of the problem I put together a simple tool to create cluster maps. The code is on github) and there is a live service at http://iphylo.org/~rpage/cluster-map/. The service takes a simple tab-delimited file that lists sets and their members, computes the overlap between the sets, calls Graphviz to layout a graph in SVG, then draws in the members of each cluster (phew).

The input file looks something like this:

Molossops aequatorianus
Chaerephon aloysiisabaudiae
Tadarida aloysiisabaudiae
Chaerephon ansorgei
Tadarida ansorgei
Molossus ater
Mormopterus petrophilus
Sauromys petrophilus


What can we do with this tool? Well, I created a quick list of all the species of bat in the family Molossidae according to GBIF. The sets are the bat genera, the members are the species (you can see the file here). I then ran this through the cluster map, and got something like this (this is only part of the cluster map):

Bats

(now can you see why I call these "papaya plots"?). Note that there are species names (i.e., specific epithets) in common to more than one genus. Some of these may be perfectly OK (it's not unusual for the same epithet to be used in different species, e.g. "major", etc.). But in many cases these bat species turn out to be the same species, just in different genera in different classifications. For example, GBIF has both Cynomops greenhalli and Molossops greenhalli. These are the same thing. Species in the genus Mormopterus may also occur in other genera. In some cases the issue is competing classifications, sometimes it is conflict over whether a species is a species or merely a subspecies, and some generic conflicts are because some genera are relegated to subgeneric status in some classifications. In short, it's an unholy mess.

Does this matter? Well, consider Mormopterus petrophilus and Sauromys petrophilus, which GBIF both regard as valid species (they're the same thing). Here are the distributions for the two different names in GBIF:

MormopterusSauromys


Depending on which name you use you'll get a very different picture of the distribution of this bat.

The next step is to figure out how to fix this. Is there a way we can automate fixing the GBIF classification so that it is not riddled with spurious duplicates like these?

Wednesday, June 13, 2012

Visualising differences between classifications using cluster maps

As part of a project to build a tool to navigate through taxonomic names and classifications I've become interested in quick ways to compare classifications. For example, EOL has multiple classifications for the same taxon, and I'd like to quickly discover what the similarities and differences are.

One promising approach is to use "cluster maps", a technique described by Fluit et al. (see Aduna Cluster Map for an implementation):

Fluit, C., Sabou, M., & Harmelen, F. (2006). Visualizing the Semantic Web. (V. Geroimenko & C. Chen, Eds.) (pp. 45–58). Springer Science + Business Media. doi:10.1007/1-84628-290-X_3 (see also http://www.cs.vu.nl/~frankh/abstracts/VSW05.html)

Cluster map details

Cluster maps can be thought of as fancy Venn Diagrams, in that they can be used to depict the overlap between sets of objects. The diagram is a graph with two kinds of nodes. One represents categories (in the example above, file formats and search terms), the other represents sets of objects that occur in one or more categories (in the example above, these are files that match the search terms "rdf" and "aperture").

I've cobbled together a crude version of cluster maps. For a given taxon (e.g., a genus) I list all the immediate sub-taxa (e.g., species) in each classification in EOL, and then find the sets of sub-taxa that are shared across the classification sources (e.g., ITIS, NCBI, etc.) and those that are unique to one source. I then create the cluster map using Graphviz. Inspired by the hexagonal packing used by Aduna, I've done something similar to display the taxa in each set. Adding these to the output of Graphviz required a little fussing with. First I get Graphviz to output the graph in SVG, then I load the SVG into a program that locates each node in the graph and inserts SVG for the packed circles (given that SVG is XML this is fairly straightforward).

As an example, consider the genus Demansia (http://eol.org/pages/34967/overview). EOL reports four classifications for this genus. Below is a cluster map for this genus:

34967

This diagram show that, for example, the Catalogue of Life (CoL) and Reptile databases share 4 names, these databases share three other names with ITIS. All databases have names unique to themselves, one database (NCBI) is completely disconnected from the other three databases.

One important caveat here is that I'm mapping the scientific names as returned by EOL, and in many cases these contain the taxonomic authority. This is a major headache, prompting this outburst:


If we clean the names by removing the taxonomic authority the clusters overlap rather more:
Demansia
Now we see that only ITIS and the Reptile Database have unique names. This is one reason why I get stroppy when taxonomists start saying databases shouldn't have to supply cleaned "canonical" names. If the names have authorities then I have to clean them, because in many cases the authorities (while useful to know) are inconsistent across databases. For example:

  • Demansia olivacea GRAY 1842 versus Demansia olivacea (Gray, 1842)
  • Demansia torquata GÜNTHER 1862 versus Demansia torquata (Günther, 1862)

Taxonomic authorities are frequently misspelt, and people seem confused about when to use parentheses or not. Databases should spare the user some pain and provide clean names (and authority strings separately where they have them).

The visualisation is still incomplete (I need to make it interactive), but it shows promise. The names that are unique to one database are usually worth investigating. In some cases they are names other databases regard as synonyms, in other cases they represent spelling variations. The goal of this visualisation is to highlight the names that the user might want to investigate further.

Wednesday, May 30, 2012

The GBIF classification is broken — how do we fix it?

This post arose from an ongoing email conversation with Tony Rees about extracting and annotating taxonomic names. In BioStor I use the GBIF classification to display the taxonomic names found in the OCR text in the form of a tree. The idea is to give the reader a sense of "what the paper is about". I also use the classification to help link to GBIF occurrence records.

The GBIF backbone classification ("nub") is probably the single largest classification of life that has been assembled, and provides GBIF users with a way to navigate through GBIF's collection of specimen and observation records. Given the scale of the undertaking it is inevitable that there will be issues with the classification, and this post provides one example.

On the page for the article "Further additions to the known marine Molluscan fauna of St. Helena" (http://biostor.org/reference/88554, see also http://dx.doi.org/10.1080/00222939208677383) part of the classification looks like this:

└Animalia
└Annelida
└Polychaeta
└Sabellida
└Serpulidae
└Hipponyx
Tony points out that "Hipponyx" is a mollusc, yet in the GBIF classification appears in the annelid worms.

Like a fool I started to investigate further. First off, what is "Hipponyx"? Browsing the GBIF classification there are species of Hipponyx and Hipponix under the genus Hipponix, so it looks like we have two alternative spellings of this genus name. Nomenclator Zoologicus has both spellings, Hipponix credited to DeFrance 1819 Journ. de Physique, 88, 217, and Hipponyx credited to Defrance 1819 Bull. Sci. Soc. philom. Paris, 8. Gotta love those cryptic citations. After some digging around in BHL I found Journ. de Physique, 88, 217 (Mémoire sur un nouveau genre de mollusque) and Bull. Sci. Soc. philom. Paris, 8. (Sur un nouveau genre de coquilles (Hipponix)). Both papers are by Jacques Louis Marin DeFrance, and both use the spelling Hipponix (no 'y'). I'm guessing the second paper is actually the original description of the genus, but my French is abysmal (Google Translate to the rescue).

OK, so we have two spellings of what is probably the same thing (and I've no idea why we have two spellings). Both spellings seem in use (see Google NGrams chart below).

Ngram

So, bit of a mess, but this still doesn't deal with Hipponyx being a worm in GBIF. After a bit of Googling on "Serpulidae" and "Hipponyx" I came across a specimen record from Te Papa labelled "Worm, Temporaria inexpectata (Mestayer, 1929); holotype; holotype of Hipponyx inexpectata Mestayer, 1929". I then came across this paper:

Fleming, C. A. (1971). A preliminary list of New Zealand fossil polychaetes. New Zealand Journal of Geology and Geophysics, 14(4), 742–756. doi:10.1080/00288306.1971.10426332

with the following abstract:
An annotated list of fossil “worm tubes” from New Zealand includes both published and new records from Mesozoic and Cenozoic deposits.

The binomen Zoophycos plicatus (Hutton) is proposed for the trace fossil long known as the Amuri fucoid, of unknown zoological affinity.

The following living species are recorded as New Zealand fossils for the first time: Protula bispiralis (Savigny), Salmacina dysteri (Huxley), Hydroides norvegicus Gunnerus, Pomatoceras cariniferus (Gray), P. aff. terranovae (Benham), Galeolaria hystrix (Moerch), Boccardia ? polybranchia (Haswell); new records of fossil species are Ditrupa cf. plana (Sowerby), Dorsoserpula lumbricalis (Schlotheim), and Neomicrorbis crenatostriatus (Münster). The name Hipponyx inexpectata Mestayer 1929, applied to a serpulid operculum, is used in the combination Temporaria inexpectata for a tubeworm common in deep water off New Zealand that has also been identified, with associated operculum, from the bathyal Waitotaran (Pliocene) sediments of Palliser Bay. Serpula wharjensis Wilkens and S. ougenensis Chapman are placed in Sclerostyla Moerch. Two species of Vermiliopsis and two of Spirorbis are figured but not named specifically.

The author of the paper (Charles Fleming) argues that Hipponyx inexpectata, regarded as a mollusc by its describer (Marjorie K. Mestayer, see Notes on New Zealand Mollusca. No. 4.) is actually a worm, and he moves it to the genus Temporaria.

So it seems that the reason Hipponyx has ended up being a worm in the GBIF classification is due to this synonymy.

Now, this little investigation was "fun", but took a couple of hours. Much of that was spent tracking down the literature and adding it to BioStor, which is a one-time cost. Not every issue with the GBIF classification will take this long to resolve, some cases may take longer. So there's a problem of scalability. Then there's the issue of how this information gets into the GBIF classification so we fix it (and so that people don't think Hipponyx is a worm). As has been said several times before, most eloquently by David Shorthouse, isn't it time we started using software development tools such as version control to help build, annotate, and correct classifications such as the one that underpins GBIF? That way when somebody spots an error it can be flagged, and someone with the time (and curiosity) can fix it.

Tuesday, October 06, 2009

Wikipedia and Gregg's paradox

Continuing the theme of taxonomic classification in Wikipedia, I'm perversely delighted that Wikipedia demonstrates Gregg's paradox so nicely.

1s2mges1n3b5q1bnvf5a3i4u8y_2009-05-31.jpgThe late John R. Gregg wrote several papers and a book exploring the logical structure of taxonomy. His 1954 book The language of taxonomy stimulated a debate a decade later in Systematic Zoology concerning what Buck and Hull (1966) (doi:10.2307/2411628) termed "Gregg's Paradox".

Gregg showed that if we (a) treat taxa as sets defined by extension (i.e., by listing all members), and (b) accept that two sets with exactly the same content must be the same set, then many biological classifications violate these premises because the same taxon may be assigned to multiple levels in the Linnean hierarchy. For example, the aardvark, Orycteropus afer, is the only extant species of the genus Orycteropus, which is the only extant member of the family Orycteropodidae, which in turn is the sole extant representative of the order Tubulidentata. Under Gregg's model, Tubulidentata, Orycteropodidae, and Orycteropus are all the same thing as they have exactly the same content (i.e., Orycteropus afer). Put another way, monotypic taxa are redundant and violate basic set theory. Gregg would argue that they should be eliminated.

aardvark.pngWikipedia illustrates this nicely. Wikipedia conforms to Gregg's model in that taxa are defined by extension (each taxon comprises one or more wiki pages), and if taxa have the same content only one taxon (typically that with the lowest taxonomic rank) has a page in Wikipedia. Put another way, if the aardvark is the sole representative of the Tubulidentata, then there is nothing that could be put on the Tubulidentata page that shouldn't also belong on the page for the aardvark. As a result, the page for the aardvark gives a full classification of this animal, but most taxa in the hierarchy don't have their own pages.

Responses

There are several possible responses to Gregg's paradox. One is to argue that taxa should be defined intensionally (i.e., on the basis of their characters), which was Buck and Hull's approach. Essentially, they were arguing that we could (somewhat arbitrarily) specify properties of Orycteropodidae that weren't shared by all Tubulidentata, and hence we are justified in keeping these taxa separate. Gregg himself was less than impressed by this argument (doi:10.2307/2412017).

Another approach is to suggest that we may discover taxa in the future that will, say, be members of Orycteropus but which aren't O. afer, and that the taxa between the rank suborder and species are placeholders for these discoveries. Indeed, in the case of the Tubulidentata there are extinct aardvarks (doi:10.1163/002829675x00137, doi:10.1016/j.crpv.2005.12.016, and doi:10.1111/j.1096-3642.2008.00460.x) that could be added to Wikipedia, thus justifying the creation of pages for the taxa that Gregg would have us eliminate.

Of course, Gregg's paradox is a consequence of having ranks and requiring each rank (or at least a reasonable subset of them) to exist in a classification. If we ignore ranks, then there's no reason to put any taxa between Afrotheria and Orycteropus afer. So, we could drop this requirement for having taxa at each rank or, of course, drop ranks altogether, which is one of the motivations behind phylogenetic classifications (e.g., the phylocode).

Implications for parsing Wikipedia

From a practical point of view, Gregg's paradox means that one has to be careful parsing Wikipedia Taxoboxes. As I've argued earlier, the simplest way to ensure that a classification is a tree is for each taxon to include a unique parent taxon. The simplest way to extract this for a taxon in a Wikipedia page would be to retrieve the taxon immediately above it in the classification (i.e., for Orycteropus afer this would be Orycteropus). But Orycteropus doesn't have a page in Wikipedia (OK, it does, but it's a redirect to the page for the aardvark). So, we have to go up the classification until we hit Afrotheria before we get a taxon page.

Personally I quite like the fact that a largely forgotten argument from the middle of the last century concerning logic and Linnean taxonomy seems relevant again.

Monday, October 05, 2009

Wikipedia's taxonomic classification is badly broken

Wikipedia is wonderful, but parts of it are horribly broken. Take, for example, taxonomic classifications. A classification is a rooted tree, which means that each node in the tree has a single parent. We can store trees in databases in a variety of ways. For example, for each node we could store a list of its children, or we could store the single unique parent of each node. Ideally we'd choose to store one or other, but not both. If we store both sets of statements (i.e., that node A has node B as one of its children, and that node B's parent is node A) then there is enormous potential for these two statements to get out of sync.
tree.png


This is what has happened in Wikipedia. Each page for a taxon lists the lineage to which it belongs (i.e., its parent, and its parent's parent, and so on), and also lists the children of that node. What this means is that if somebody edits the page for taxon A and adds taxon B as a child, they also need to edit the page for taxon B to make A its parent. If only one of these two edits is made the classification may end up internally inconsistent.

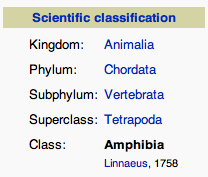
For example, the page for Amphibia lists the classification of Amphibia like this:
a1.png

It also lists the child taxa of Amphibia:
a2.png

So, the children of Amphibia are Temnospondyli, Lepospondyli, and Lissamphibia. Furthermore, Anura, Caudata, and Gymnophiona are children of Lissamphibia:

child.png


Given this, if I go to the pages for Anura, Caudata, and Gymnophiona I should see that each of these taxa lists Lissamphibia as its parent. However, only one of these (Caudata) does: the Anura and Gymnophiona both have Amphibia as their parents, not Lissamphibia.

The diagram below shows the taxa that have Amphibia as their parent:
parent.png


Note that Stegocephalia have now turned up as an addition amphibian order, and that only Caudata is included in Lissamphibia. But what is striking is that another 274 Wikipedia taxon pages have Amphibia as their parent. These pages are all for fossil amphibians that do not fit easily in the existing Wikipedia classification.

From the perspective of building a database, the "has parent" relationship is the one I'd prefer to use, because that statement is going to be made just once (on the page for the taxon of interest). This seems a lot safer than making the statement "has child" on another page (for one thing, more than one page could claim a taxon as their child, which again will break the tree). But if we use the "has parent" relationship, our tree will be very bushy, with lots of fossil amphibian genera attached to the Amphibia node. This is going to make the tree hard to interpret, because this basal bush isn't saying that all these genera radiated off at once, but rather that we don't really know where in the amphibian tree these things go, so we'll have to settle for saying merely "they are amphibians" (for the cladistic theorists among you, this is Nelson and Platnick's "interpretation 2" in their "Multiple Branching in Cladograms: Two Interpretations", doi:10.2307/2412630).

So, the dilemma is whether to use "has child" relationships, and accept that these are likely to be inconsistent with the inverse "has parent" relationship, or use the "has parent" relationship, which will be internally consistent, but at the cost of potentially very large, unresolved bushes due to fossil taxa of uncertain affinities.

Monday, August 31, 2009

Comparing Wikipedia and Mammal Species of the World classifications


Continuing the saga of making sense of the mammal classification in Wikipedia, I've done a quick comparison with the Mammal Species of the World (third edition) classification. MSW is the default taxonomic reference used by WikiProject Mammals. I downloaded the MSW taxonomy as a CSV file (warning, it's big), and wrote a script to pull out the classification as a GML file (my preferred graph format).

Based on some earlier work with Gabriel Valiente, I wrote a simple program that takes two trees and highlights the nodes in common to the two trees. I then input into this program the MSW tree, and the largest component of the graph of Wikipedia mammals. The MSW tree has 13582 nodes, the Wikipedia tree has 6287. Note that Wikipedia has more taxa than these 6287 nodes suggest, but they aren't connected to the largest tree (often due to intermediate nodes in the classification lacking a page in Wikipedia). The two trees have 4935 nodes in common (again, this number will be a little low, there are some weird taxon names due to problems parsing Wikipedia).

MSW versus Wikipedia
Below is a the MSW classification with taxa in Wikipedia shown in red.
w-msw.jpg


[Larger scale view here]

The impression given is that most Wikipedia mammal pages are in MSW, with some notable exceptions, including higher level taxa such as Afrotheria, and extinct taxa such as the Multituberculata. Some extant taxa are missing due to synonymy. For example, Wikipedia gives the scientific name of Anthony's pipistrelle as Pipistrellus anthonyi, whereas MSW has it as Hypsugo anthonyi.
As an aside, Wikipedia pages often get muddled about parentheses around taxonomic author names. The authority is in parentheses if the current genus is not the original genus the species was placed. Hence, Pipistrellus anthonyi (Tate, 1942) should actually be Pipistrellus anthonyi Tate, 1942, as Tate originally described this taxon as a species of Pipistrellus (see hdl:2246/1783). However, the name Hypsugo anthonyi (Tate, 1942) does need parentheses.


Some Wikipedia taxa also postdate the publication of MSW, such as Philander deltae (see doi:10.1644/05-MAMM-A-065R2.1).


Wikipedia versus MSW
When we do the reverse comparison we see something rather different.

msw-w.jpg


[Larger scale view here]

This is the MSW tree, coloured red where the MSW taxon has a page in Wikipedia. There are big gaps, some of which are due to those pages being in another component (in other words, many "missing" taxa do have pages in Wikipedia, they are just not properly linked to the bigger tree). MSW is also rich in subspecies, which tend to lack their own pages in Wikipedia (possibly a good thing in the cases of taxa such as pocket gophers).

It would be nice to make these comparisons automatic, and develop tools so that managing taxonomy in Wikipedia could be made easier.

Saturday, August 29, 2009

Mammal tree from Wikipedia

Following on from my previous post about visualising the mammalian classification in Wikipedia, I've extracted the largest component from the graph for all mammal taxa in Wikipedia, and it is a tree. This wasn't apparent in the previous diagram, where the component appeared as a big ball due to the layout algorithm used.
tree.jpg


What this suggests is that Wikipedia contributors are quite capable of generating trees, it's just that not all the bits of the tree are connected (hence all the components in the previous post.

As Cyndy Parr suggested in her comments, it would be useful to compare the Wikipedia-derived tree with other trees, say from Mammal species of the World or ITIS.

Monday, February 02, 2009

Wiki modelling - Part 2

Modelling taxa is a bit trickier. I've sketched my ideas for distinguishing name strings and taxonomic names earlier. That's the easy stuff. What about "taxonomic concepts" and "OTUs"? As a first pass, I'm looking at linking taxon names to classifications via GUIDs. If a taxon appears in a classification then the GUID of the corresponding node in the classification is an attribute of the taxon name, and each classification GUID (representing a node in a classification) corresponds to a page in the Wiki.


I claim no originality for this, it's very close to how uBio models classification concepts:


The trick here is going to be ensuring that I can do sensible queries, such as linking a node in a classification to alternative names.

The other entity that I need to think carefully about are OTUs (Operational Taxonomic Units). By OTUs I mean the taxa that appear in phylogenetic trees. In the TbMap project I mapped TreeBASE taxa to names in external databases, but noted that TreeBASE taxa are better thought of as OTUs:

...many taxon names in TreeBASE are best though of as Operational Taxonomy Units (OTUs) rather than taxonomic names. They identify a set of observations for a particular specimen, set of specimens, or a taxon. For instance, "Eleutherodactylus crassidigitus FMNH257676 Panama" (TaxonID T51971) refers to a 1200 base pair stretch of mitochondrial DNA (AY273113) obtained from Field Museum Natural History specimen FMNH 257676, which has been identified as Eleutherodactylus crassidigitus. [see doi:10.1186/1471-2105-8-158.

Taxa in phylogenetic trees may be single sequences, multiple sequences (from one or more specimens), or aggregates of information from multiple taxa. The challenge is to model these in the simplest way that reflects this, but also makes queries feasible. What I'm aiming for is for the user to click on a node in a phylogeny, and be taken to a page that best corresponds to the entity in the tree, but at the same time enable queries that will list all phylogenies that contain a given taxon.

Wednesday, November 28, 2007

Transitive reduction

Quick note to self, having stumbled on the Wikipedia page on transitive reduction. Given a graph like this:

the transitive reduction is:

Note that the original graph has an edge a -> d, but this is absent after the reduction because we can get from a to d via b (or c).


What's the point? Well, it occurs to me that a quick way of harvesting information about existing taxonomies (e.g., if we want to assemble an all embracing classification of life to hep navigate a database) is to make use of the titles of taxonomic papers, e.g., the title Platyprotus phyllosoma, gen. nov., sp. nov., from Enderby Land, Antarctica, an unusual munnopsidid without natatory pereopods (Crustacea: Isopoda: Asellota) gives us:

Crustacea -> Isopoda -> Asellota ->Platyprotus -> phyllosoma

From the paper, and or other sources we can get paths such as Asellota -> Munnopsididae -> Platyprotus and Isopoda -> Munnopsididae. Imagine that we have a set of these paths, and want to assemble a classification (for example, we want to grow the Species 2000 classification, which lacks this isopod). Here's the graph:


This clearly gives us information on the classification of the isopod, but it's not a hierarchy. The transitive reduction, however, is:


It would be fun to explore using this technique to mine taxonomic papers and automate the extraction of classifications, as well as names.