Showing posts with label data quality. Show all posts

Monday, October 25, 2021

Problems with Plazi parsing: how reliable are automated methods for extracting specimens from the literature?

The Plazi project has become one of the major contributors to GBIF with some 36,000 datasets yielding some 500,000 occurrences (see Plazi's GBIF page for details). These occurrences are extracted from taxonomic publication using automated methods. New data is published almost daily (see latest treatments). The map below shows the geographic distribution of material citations provided to GBIF by Plazi, which gives you a sense of the size of the dataset.

By any metric Plazi represents a considerable achievement. But often when I browse individual records on Plazi I find records that seem clearly incorrect. Text mining the literature is a challenging problem, but at the moment Plazi seems something of a "black box". PDFs go in, the content is mined, and data comes up to be displayed on the Plazi web site and uploaded to GBIF. Nowhere does there seem to be an evaluation of how accurate this text mining actually is. Anecdotally it seems to work well in some cases, but in others it produces what can only be described as bogus records.

Finding errors

A treatment in Plazi is a block of text (and sometimes illustrations) that refers to a single taxon. Often that text will include a description of the taxon, and list one or more specimens that have been examined. These lists of specimens ("material citations") are one of the key bits of information that Plaza extracts from a treatment as these citations get fed into GBIF as occurrences.

To help explore treatments I've constructed a simple web site that takes the Plazi identifier for a treatment and displays that treatment with the material citations highlighted. For example, for the Plazi treatment 03B5A943FFBB6F02FE27EC94FABEEAE7 you can view the marked up version at https://plazi-tester.herokuapp.com/?uri=622F7788-F0A4-449D-814A-5B49CD20B228. Below is an example of a material citation with its component parts tagged:

This is an example where Plazi has successfully parsed the specimen. But I keep coming across cases where specimens have not been parsed correctly, resulting in issues such as single specimens being split into multiple records (e.g., https://plazi-tester.herokuapp.com/?uri=5244B05EFFC8E20F7BC32056C178F496), geographical coordinates being misinterpreted (e.g., https://plazi-tester.herokuapp.com/?uri=0D228E6AFFC2FFEFFF4DE8118C4EE6B9), or collector's initials being confused with codes for natural history collections (e.g., https://plazi-tester.herokuapp.com/?uri=252C87918B362C05FF20F8C5BFCB3D4E).

Parsing specimens is a hard problem so it's not unexpected to find errors. But they do seem common enough to be easily found, which raises the question of just what percentage of these material citations are correct? How much of the data Plazi feeds to GBIF is correct? How would we know?

Systemic problems

Some of the errors I've found concern the interpretation of the parsed data. For example, it is striking that despite including marine taxa no Plazi record has a value for depth below sea level (see GBIF search on depth range 0-9999 for Plazi). But many records do have an elevation, including records from marine environments. Any record that has a depth value is interpreted by Plazi as being elevation, so we have aerial crustacea and fish.

Map of Plazi records with depth 0-9999m

Map of Plazi records with elevation 0-9999m

Anecdotally I've also noticed that Plazi seems to do well on zoological data, especially journals like Zootaxa, but it often struggles with botanical specimens. Botanists tend to cite specimens rather differently to zoologists (botanists emphasise collector numbers rather than specimen codes). Hence data quality in Plazi is likely to taxonomic biased.

Plazi is using GitHub to track issues with treatments so feedback on erroneous records is possible, but this seems inadequate to the task. There are tens of thousands of data sets, with more being released daily, and hundreds of thousands of occurrences, and relying on GitHub issues devolves the responsibility for error checking onto the data users. I don't have a measure of how many records in Plazi have problems, but because I suspect it is a significant fraction because for any given day's output I can typically find errors.

What to do?

Faced with a process that generates noisy data there are several of things we could do:

  1. Have tools to detect and flag errors made in generating the data.
  2. Have the data generator give estimates the confidence of its results.
  3. Improve the data generator.

I think a comparison with the problem of parsing bibliographic references might be instructive here. There is a long history of people developing tools to parse references (I've even had a go). State-of-the art tools such as AnyStyle feature machine learning, and are tested against human curated datasets of tagged bibliographic records. This means we can evaluate the performance of a method (how well does it retrieve the same results as human experts?) and also improve the method by expanding the corpus of training data. Some of these tools can provide a measures of how confident they are when classifying a string as, say, a person's name, which means we could flag potential issues for anyone wanting to use that record.

We don't have equivalent tools for parsing specimens in the literature, and hence have no easy way to quantify how good existing methods are, nor do we have a public corpus of material citations that we can use as training data. I blogged about this a few months ago and was considering using Plazi as a source of marked up specimen data to use for training. However based on what I've looked at so far Plazi's data would need to be carefully scrutinised before it could be used as training data.

Going forward, I think it would be desirable to have a set of records that can be used to benchmark specimen parsers, and ideally have the parsers themselves available as web services so that anyone can evaluate them. Even better would be a way to contribute to the training data so that these tools improve over time.

Plazi's data extraction tools are mostly desktop-based, that is, you need to download software to use their methods. However, there are experimental web services available as well. I've created a simple wrapper around the material citation parser, you can try it at https://plazi-tester.herokuapp.com/parser.php. It takes a single material citation and returns a version with elements such as specimen code and collector name tagged in different colours.

Summary

Text mining the taxonomic literature is clearly a gold mine of data, but at the same time it is potentially fraught as we try and extract structured data from semi-structured text. Plazi has demonstrated that it is possible to extract a lot of data from the literature, but at the same time the quality of that data seems highly variable. Even minor issues in parsing text can have big implications for data quality (e.g., marine organisms apparently living above sea level). Historically in biodiversity informatics we have favoured data quantity over data quality. Quantity has an obvious metric, and has milestones we can celebrate (e.g., one billion specimens). There aren't really any equivalent metrics for data quality.

Adding new types of data can sometimes initially result in a new set of quality issues (e.g., GBIF metagenomics and metacrap) that take time to resolve. In the case of Plazi, I think it would be worthwhile to quantify just how many records have errors, and develop benchmarks that we can use to test methods for extracting specimen data from text. If we don't do this then there will remain uncertainty as to how much trust we can place in data mined from the taxonomic literature.

Update

Plazi has responded, see Liberating material citations as a first step to more better data. My reading of their repsonse is that it essentially just reiterates Plazi's approach and doesn't tackle the underlying issue: their method for extracting material citations is error prone, and many of those errors end up in GBIF.

Friday, September 11, 2020

Darwin Core Million reminder, and thoughts on bad data

Bob mesibovThe following is a guest post by Bob Mesibov.

No winner yet in the second Darwin Core Million for 2020, but there are another two and a half weeks to go (to 30 September). For details of the contest see this iPhylo blog post. And please don’t submit a million RECORDS, just (roughly) a million DATA ITEMS. That’s about 20,000 records with 50 fields in the table, or about 50,000 records with 20 fields, or something arithmetically similar.


The purpose of the Darwin Core Million is to celebrate high-quality occurrence datasets. These are extraordinarily rare in biodiversity informatics.

I’ll unpick that. I’m not talking about the accuracy of the records. For most records, the “what”, “where”, “when” and “by whom” are probably correct. An occurrence record is a simple fact: Wilma Flintstone collected a flowering specimen of an Arizona Mountain Dandelion 5 miles SSE of Walker, California on 27 June 2019. More technically, she collected Agoseris parviflora at 38.4411 –119.4393, as recorded by her handheld GPS.

What could possibly go wrong in compiling a dataset of simple records like that in a spreadsheet or database? Let me count a few of the ways:

  • data items get misspelled or misnumbered
  • data items get put in the wrong field
  • data items are put in a field for which they are invalid or inappropriate
  • data items that should be entered get left out
  • data items get truncated
  • data items contain information better split into separate fields
  • data items contain line breaks
  • data items get corrupted by copying down in a spreadsheet
  • data items disagree with other data items in the same record
  • data items refer to unexplained entities (“habitat type A”)
  • paired data items don’t get paired (e.g. latitude but no longitude)
  • the same data item appears in different formats in different records
  • missing data items are represented by blanks, spaces, “?”, “na”, “-”, “unknown”, “not recorded” etc, all in the same data table
  • character encoding failures create gibberish, question marks and replacement characters (�)
  • weird control characters appear in data items, and parsing fails
  • dates get messed up (looking at you, Excel)
  • records get duplicated after minor edits

In previous blog posts (here and here) I’ve looked at explanations for poor-quality data at the project, institution and agency level — data sources I referred to collectively as the “PIA”. I don’t think any of those explanations are controversial. Here I’m going to be rude and insulting and say there are three further obstacles to creating good, usable and shareable occurrence data:

Datasets are compiled as though they were family heirlooms.

The PIA says “This database is OUR property. It’s for OUR use and WE understand the data, even if it’s messy and outsiders can’t figure out what we’ve done. Ambiguities? No problem, we’ll just email Old Fred. He retired a few years back but he knows the system back to front.”

Prising data items from these heirlooms, mapping them to new fields and cleaning them are complicated exercises best left to data specialists. That’s not what happens.

Datasets are too often compiled by people with inadequate computer skills. Their last experience of data management was building a spreadsheet in a “digital learning” class. They’re following instructions but they don’t understand them. Both the data enterers and their instructors are hoping for a good result, which is truly courageous optimism.

The (often huge) skills gap between the compilers of digital PIA data and the computer-savvy people who analyse and reformat/repackage the data (users and facilitators-for-users) could be narrowed programmatically, but isn’t. Hands up all those who use a spreadsheet for data entry by volunteers and have comprehensive validation rules for each of the fields? Thought so.

People confuse software with data. This isn’t a problem restricted to biodiversity informatics, and I’ve ranted about this issue elsewhere. The effect is that data compilers blame software for data problems and don’t accept responsibility for stuff-ups.

Sometimes that blaming is justified. As a data auditor I dread getting an Excel file, because I know without looking that the file will have usability and shareability issues on top of the usual spreadsheet errors. Excel isn’t an endpoint in a data-use pipeline, it’s a starting point and a particularly awful one.

Another horror is the export option. Want to convert your database of occurrence records to format X? Just go to the “Save as” or “Export data” menu item and click “OK”. Magic happens and you don’t need to check the exported file in format X to see that all is well. If all is not well, it’s the software’s fault, right? Not your problem.

In view of these and the previously blogged-about explanations for bad data, it’s a wonder that there are any high-quality datasets, but there are. I’ve audited them and it’s a shame that for ethical reasons I can’t enter them myself in the current Darwin Core Million.

Monday, August 10, 2020

Australian museums and ALA

Bob mesibovThe following is a guest post by Bob Mesibov.

The Atlas of Living Australia (ALA) adds "assertions" to Darwin Core occurrence records. "Assertions" are indicators of particular data errors, omissions and questionable entries, such as "Coordinates are transposed", "Geodetic datum assumed WGS84" and "First [day] of the century".

Today (8 August 2020) I looked at assertions attached to records in ALA for non-fossil animals in the Australian State museums. There were 62 occurrence record collections from the seven museums (I lumped the two Tasmanian museums together), with 45 different assertions. I then calculated assertions per record for each collection. The worst performer was the Queensland Museum Porifera collection (3.84 ass/rec), and tied for best were the Museums Victoria Herpetology and Ichthyology collections (1.09 ass/rec).

I also aggregated museum collections to build a kind of league table by State:

The clear winner is Museums Victoria.

But how well do ALA's assertions measure the quality of data records? Not all that well, actually.

  • The tests used to make the assertions generate false positives and false negatives, although at a low rate
  • The tests aren't independent, so that a single data error can "smear" across several assertions
  • The tests ignore errors and omissions in DwC fields that many data users would consider important

ALA's assertions also have a strong spatial/geographical bias, with 23 of the 45 assertions in my sample dataset saying something about the "where" of the occurrence. Looking just at those 23 "where" assertions, the museums league table again shows Museums Victoria ahead, this time by a wide margin:

ALA is currently working on better ways for users to filter out records with selected assertions, in what's misleadingly called a "Data Quality Project". The title is misleading because the overall quality of ALA's holdings doesn't improve one bit. Getting data providers to fix their data issues would be a more productive way to upgrade data quality, but I haven't seen any evidence that Australian museums (for example) pay much attention to ALA's assertions. (There are no or minimal changes in assertion totals between data updates.)

It's been pointed out to me that that museum and herbarium records amount to only a small fraction of ALA's ca 90 million records, and that citizen scientists are growing the stock of occurrence records far faster than institutions do. True, and those citizen science records are often of excellent quality (see https://www.datafix.com.au/BASHing/2020-02-05.html). However, citizen science observations are strongly biased towards widespread and common species. ALA's records for just six common Australian birds (5,072,599 as of 8 August 2020; https://dashboard.ala.org.au/) outnumber all the museum animal records I looked at in the assertion analysis (4,669,508).

In my humble view, the longer ALA's institutional data providers put off fixing their mistakes, the less valuable ALA becomes as a bridge between biodiversity informatics and biodiversity science.


Monday, March 23, 2020

Darwin Core Million promo: best and worst

Bob mesibovThe following is a guest post by Bob Mesibov.
There's still time (to 31 March) to enter a dataset in the 2020 Darwin Core Million, and by way of encouragement I'll celebrate here the best and worst Darwin Core datasets I've seen.
The two best are real stand-outs because both are collections of IPT resources rather than one-off wonders.


The first is published by the Peabody Museum of Natural History at Yale University. Their IPT website has 10 occurrence datasets totalling ca 1.6M records updated daily, and I've only found minor data issues in the Peabody offerings. A recent sample audit of the 151,138 records with 70 populated Darwin Core fields in the botany dataset (as of 2020-03-18) showed refreshingly clean data:
  • entries correctly assigned to DwC fields
  • no missing-but-expected entry gaps
  • consistent, widely accepted vocabularies and formatting in DwC fields
  • no duplicate records
  • no character encoding errors
  • no gremlin characters
  • no excess whitespace or fancy alternatives to simple ASCII characters
The dataset isn't perfect and occurrenceRemarks entries are truncated at 254 characters, but other errors are scarce and easily fixed, such as
  • 14 records with plant taxa mis-classified as animals
  • 4 records with dateIdentified earlier than eventDate
  • minor pseudo-duplication in several fields, e.g. "Anna Murray Vail; Elizabeth G. Britton" and "Anne Murray Vail; Elizabeth G. Britton" in recordedBy
  • minor content errors in some entries, e.g. "tissue frozen; tissue frozen" and "|" (with no other characters in the entry).
I doubt if it would take more than an hour to fix all the Peabody Museum issues besides the truncation one, which for an IPT dataset with 10.5M data items is outstanding. There are even fields in which the Museum has gone beyond what most data users would expect. Entries in vernacularName, for example, are semicolon-separated hierarchies of common names: "dwarf snapdragon; angiosperms; tracheophytes; plants" for Chaenorhinum minus.

The second IPT resource worth commending comes from GBIF Portugal and consists of 108 checklist, occurrence record and sampling event datasets. As with the Peabody resource, the datasets are consistently clean with only minor (and scattered) structural, format or content issues.

The problems appearing most often in these datasets are "double-encoding" errors with Portugese words and no-break spaces in place of plain spaces, and for both of these we can probably blame the use of Windows programs (like Excel) at the contributing institutions. An example of double-encoding: the Portugese "prôximo" is first encoded in UTF-8 as a 2-byte character, then read by a Windows program as two separate bytes, then converted back to UTF-8, resulting in the gibberish "prôximo". A large proportion of the no-break spaces in the Portugese datasets unfortunately occur in taxon name strings, which don't parse correctly and which GBIF won't taxon-match.

And the worst dataset? I've seen some pretty dreadful examples from around the world, but the UK's Natural History Museum sits at the top of my list of delinquent providers. The NHM offers several million records and a disappointingly high proportion of these have very serious data quality problems. These include invalid and inappropriate entries, disagreements between fields and missing-but-expected blanks.

Ironically, the NHM's data portal allows the visitor to select and examine/download records with any one of a number of GBIF issues, like "taxon_match_none". Further, for each record the data portal reports "GBIF quality indicators", as shown in this screenshot:


Clicking on that indicator box gives the portal visitor a list of the things that GBIF found wrong with the record (a list that overlaps incompletely with the list I can find with a data audit). I'm sure the NHM sees this facility differently, but to me it nicely demonstrates that NHM has prioritised Web development over data management. The message I get is
"We know there's a lot wrong with our data, but we're not going to fix anything. Instead, we're going to hand our mess as-is to any data users out there, with cleverly designed pointers to our many failures. Suck it up, people."
In isolation NHM might be seen as doing what it can with the resources it has. In a broader context the publication of multitudes of defective records by NHM is scandalous. Institutions with smaller budgets and fewer staff do a lot better with their data — see above.

Coronavirus

If your institution is closed and you have spare work-from-home time, consider doing some data cleaning. For those not afraid of the command line, I've archived the websites A Data Cleaner's Cookbook (version 2) and its companion blog BASHing data (first 100 posts) in Zenodo with local links between the two, so that the two resources can be downloaded and used offline in any Web browser.

Tuesday, March 03, 2020

The 2020 Darwin Core Million

Bob mesibovThe following is a guest post by Bob Mesibov.

You're feeling pretty good about your institution's collections data. After carefully tucking all the data items into their correct Darwin Core fields, you uploaded the occurrence records to GBIF, the Atlas of Living Australia (ALA) or another aggregator, and you got back a great report:

  • all your scientific names were in the aggregator's taxonomic backbone
  • all your coordinates were in the countries you said they were
  • all your dates were OK (and in ISO 8601 format!)
  • all your recorders and identifiers were properly named
  • no key data items were missing

OK, ready for the next challenge for your data? Ready for the 2020 Darwin Core Million?

How it works

From the dataset you uploaded to the aggregator, select about one million data items. That could be, say, 50000 records in 20 populated Darwin Core fields, or 20000 records in 50 populated Darwin Core fields, or something in between. Send me the data for auditing before 31 March 2020 as a zipped plain-text file by email to robert.mesibov@gmail.com, together with a DOI or other identifier for their online, aggregated presence.

I'll audit datasets in the order I receive them. If I can't any find data quality problems in your dataset, I'll pay your institution AUD$150 and declare your institution the winner of the 2020 Darwin Core Million here on iPhylo. (One winner only; datasets received after the first problem-free dataset won't be checked.)

If I find data quality problems, I'll let you know by email. If you want to learn what the problems are, I'll send you a report detailing what should be fixed and you'll pay me AUD$150. At 0.3-0.75c/record, that's a bargain compared to commercial data-checking rates. And it would be really good to hear, later on, that those problems had indeed been fixed and corrected data had been uploaded to the aggregator.

What I look for

For a list of data quality problems, see this page in my Data Cleaner's Cookbook. The key problems are:

  • duplicate records
  • invalid data items
  • data items in the wrong fields
  • data items inappropriate for their field
  • truncated data items
  • records with items in one field disagreeing with items in another
  • character encoding errors
  • wildly erroneous dates or coordinates
  • incorrect or inconsistent formatting of dates, names and other data
  • items

If you think some of this is just nit-picking, you're probably thinking of your data items as things for humans to read and interpret. But these are digital data items intended for parsing and managing by computers. "Western Hill" might not be the same as "Western Hill" in processing, for example, because the second item might have a no-break space between the words instead of a plain space. Another example: humans see these 22 variations on collector names as "the same", but computers don't.

You might also be thinking that data quality is all about data correctness. Is Western Hill really at those coordinates? Is the specimen ID correct? Is the barely legible collector name on the specimen label correctly interpreted? But it's possible to have entirely correct digital data that can't be processed by an application, or moved between applications, because the data suffer from one or more of the problems listed above.

I think my money is safe

The problems I look for are all easily found and fixed. However, as mentioned in a previous iPhylo post, the quality of the many institutional datasets that I've sample-audited ranges from mostly OK to pretty awful. I've also audited more than 100 datasets (many with multiple data tables) for Pensoft Publishers, and the occurrence records among them were never error-free. Some of those errors had vanished when the records had been uploaded to GBIF, because GBIF simply deleted the offending data items during processing (GBIF, bless 'em, also publish the original data items).

Neither institutions nor aggregators seem to treat occurrence records with the same regard for detail that you find in real scientific data, the kind that appear in tables in scientific journal articles. A comparison with enterprise data is even more discouraging. I'm not aware of any large museum or herbarium with a Curator of Data on the payroll, probably because no institution's income depends on the quality of the institution's data, and because collection records don't get audited the way company records do, for tax, insurance and good-governance purposes.

So there might be a winner this year, but I doubt it. Maybe next year. ALA has a year-long data quality project underway, and GBIF Executive Secretary Joe Miller (in litt.) says that GBIF is now paying closer attention to data quality. The 2021 Darwin Core Million prize could be yours...

Friday, December 20, 2019

GBIF metagenomics and metacrap

Yes, this is a clickbait headline, and yes, it may seem like shooting fish in a barrel to complain about crappy data in GBIF, but my point here is raise concerns about the impact of metagenomic data on GBIF, and how difficult it may be to track down the causes of errors.

I stumbled across this example while looking for specimen records for the genus Rafflesia, which are parasitic plants famous for the spectacular size of their flowers (up to 1m across).


The GBIF map for Rafflesia shows a few outliers. Unfortunately GBIF doesn't make it easy to drill down (why oh why can't we just click on the map and see the corresponding occurrences?) so I opened the map in iSpecies and clicked on each outlier in turn. The one in Vanuatu (438164267 from the Paris museum P00577336) is identified to genus level only and has the note:
Parasite terrestre, grande fleur orange au ras du sol. Incomplète suite à prédation. Très forte odeur désagréable. Récolté par Sylvain Hugel (photo) (alcool seul)
which Google translates as:
Terrestrial parasite, large orange flower at ground level. Incomplete due to predation. Very strong unpleasant odor. Collected by Sylvain Hugel (photo) (alcohol only)
Sounds a bit like Rafflesia but there's no photo or other information available online. Likewise there's no additional data for the record from Brazil (1090499968). There is a record from Madagascar that is accompanied by a photo, but it that looks nothing like Rafflesia (1261055923):


That leaves two records, 2018528337 (Rafflesia cantleyi) from off the coast of Peru, and 2014813273 (Rafflesia) off the coast of Australia. Both of these records are metagenomic. For example, occurrence 2018528337 is part of a dataset Amplicon sequencing of Tara Oceans DNA samples corresponding to size fractions for protists that, on the face of it, would be an unlikely source of occurrences of forest dwelling plants.

What we get in the GBIF occurrence record is a link to the pipeline used to generate the data (Pipeline version 4.1 - 17-Jan-2018), the sample (ERS491947), and an analysis (MGYA00167469) that summarises all the taxonomic data from the ocean water sample.


What we don't get in GBIF is an obvious way to try and figure out why GBIF thinks that large flowers live in the ocean. I followed the links from MGYA00167469 and downloaded a bunch of files, some in familiar formats (FASTA), others in formats I'd not seen before (e.g., HDF5). From the mapseq file we have the following line:

ERR562574.2494029-BISMUTH-0000:2:112:3465:9749-2/89-1 GFBU01000011.4303.6106 76 0.9634146094322205 79 3 0 6 88 1722 1804 +  sk__Eukaryota;k__Viridiplantae;p__Streptophyta;c__;o__Malpighiales;f__Rafflesiaceae;g__Rafflesia;s__Rafflesia_cantleyi 

This tells us that sequence ERR562574.2494029-BISMUTH-0000:2:112:3465:9749-2/89-1 matches GenBank sequence GFBU01000011, which is "Rafflesia cantleyi RC_11 transcribed RNA sequence" from a paper on flower development in Rafflesia cantleyi doi:10.1371/journal.pone.0167958. So, now we see why we think we have giant flowers off the coast of Peru.

The rest of the line has information on the match: the oceanic sequence has a 0.96 identity with the plant sequence, has 79 matches, 3 mismatches, and no gaps, which suggests that this is a short sequence. Going digging in the FASTA file I found the raw sequence, and it is indeed very short:

>ERR562574.2494029-BISMUTH-0000:2:112:3465:9749-2/89-1
GTCTAAGTGTCGTGAGAAGTTCGTTGAACCTGATCATTTAGAGGAAGTAGAAGTCGTAAC
AAGGTTTCCGTAGGTGAACCTGCGGAAGG


This short string is the evidence for Rafflesia in the ocean. Out of curiosity I ran this sequence through BLAST:

Query  1     GTCTAAGTGTCGTGAGAAGTTCGTTGAACCTGATCATTTAGAGGAAGTAGAAGTCGTAAC  60
             |||||||||||||| |||||||||||||||| ||||||||||||||| ||||||||||||
Sbjct  1683  GTCTAAGTGTCGTGGGAAGTTCGTTGAACCTTATCATTTAGAGGAAGGAGAAGTCGTAAC  1742

Query  61    AAGGTTTCCGTAGGTGAACCTGCGGAAGG  89
             |||||||||||||||||||||||||||||
Sbjct  1743  AAGGTTTCCGTAGGTGAACCTGCGGAAGG  1771

The top hit is Bathycoccus prasinos, a picoplanktonic alga with a world-wide distribution. This seems like a more plausible identification for this sequence (all the top 100 hits are very similar to each other, many are labelled as Bathycoccus).


So, there's something clearly amiss with the analysis of this dataset. Someone who knows more about metagenomics than I do will be better placed to explain why this pipeline got it so wrong, and how common this issue is.

Given the scale and automation of metagenomics, there will always be errors - that is inevitable. What we need is ways to catch those errors, especially ones that are going to "pollute" existing distribution data with spurious records (flowers in the ocean). And in a sense, GBIF excels at this in that it exposes data to a wider audience. If you work on marine microbiology you might not notice that your sequences apparently include forest plants, but if you work on forest plants you will almost certainly notice sequences occurring in the ocean.

A key feature of GBIF that makes it so useful is that, unlike many data repositories, it does not treat data as a "black box". GBIF is not like a library catalogue which merely tells you that they have books and where to find them, instead it is like Google Books, which can tell you which books contain a given phrase you are looking for. By opening up each dataset and indexing the contents, GBIF enables us to do data analysis (in much the same way that GenBank isn't just a catalogue of sequences, it enables you to search the sequences themselves).

This is a feature we risk losing if we treat metagenomics data as a black box. The Tara Oceans data that GBIF receives is simply a list of taxa at a locality, it's a checklist. We have to take it on trust that the taxonomic assignments are accurate, and it is not a trivial task to diagnose errors. Compare this to having the photo that accompanied the record from Madagascar, which helps us determine that the identification is wrong. Going forward, it would be helpful if we had metagenomic sequences available as part of the data download from GBIF. It's also worth considering whether GBIF should start doing its own analysis of sequence data, or asking its contributors to check that their taxonomic assignments are correct (e.g., running BLAST on the data). Otherwise GBIF users may end up having to filter their data for a growing number of completely spurious records.

Update

Looks like (occurrence 1261055923) is Langsdorffia:


Wednesday, January 24, 2018

Guest post: The Not problem

Bob mesibovThe following is a guest post by Bob Mesibov.

Nico Franz and Beckett Sterner created a stir last year with a preprint in bioRxiv about expert validation (or the lack of it) in the "backbone" classifications used by aggregators. The final version of the paper was published this month in the OUP journal Database (doi:10.1093/database/bax100).

To see what effect "backbone" taxonomies are having on aggregated occurrence records, I've recently been auditing datasets from GBIF and the Atlas of Living Australia. The results are remarkable, and I'll be submitting a write-up of the audits for formal publication shortly. Here I'd like to share the fascinating case of the genus Not Chan, 2016.

I found this genus in GBIF. A Darwin Core record uploaded by the New Zealand Arthropod Collection (NZAC02015964) had the string "not identified on slide" in the scientificName field, and no other taxonomic information.

GBIF processed this record and matched it to the genus Not Chan, 2016, which is noted as "doubtful" and "incertae sedis".

There are 949 other records of this genus around the world, carefully mapped by GBIF. The occurrences come from NZAC and nine other datasets. The full scientific names and their numbers of GBIF records are:

NumberName
2Not argostemma
14not Buellia
1not found, check spelling
1Not given (see specimen note) bucculenta
1Not given (see specimen note) ortoni
1Not given (see specimen note) ptychophora
1Not given (see specimen note) subpalliata
1not identified on slide
1not indentified
1Not known not known
1Not known sp.
1not Lecania
4Not listed
873Not naturalised in SA sp.
18Not payena
5not Punctelia
18not used
6Not used capricornia Pleijel & Rouse, 2000

GBIF cites this article on barnacles as the source of the genus, although the name should really be Not Chan et al., 2016. A careful reading of this article left me baffled, since the authors nowhere use "not" as a scientific name.

Next I checked the Catalogue of Life. Did CoL list this genus, and did CoL attribute it to Chan? No, but "Not assigned" appears 479 times among the names of suprageneric taxa, and the December 2018 CoL checklist includes the infraspecies "Not diogenes rectmanus Lanchester,1902" as a synonym.

The Encyclopedia of Life also has "Not" pages, but these have in turn been aggregated on the "EOL pages that don't represent real taxa" page, and under the listing for the "Not assigned36" page someone has written:

This page contains a bunch of nodes from the EOL staff Scratchpad. NB someone should go in and clean up that classification.

"Someone should go in and clean up that classification" is also the GBIF approach to its "backbone" taxonomy, although they think of that as "we would like the biodiversity informatics community and expert taxonomists to point out where we've messed up". Franz and Sterner (2018) have also called for collaboration, but in the direction of allowing for multiple taxonomic schemes and differing identications in aggregated biodiversity data. Technically, that would be tricky. Maybe the challenge of setting up taxonomic concept graphs will attract brilliant developers to GBIF and other aggregators.

Meanwhile, Not Chan, 2016 will endure and aggregated biodiversity records will retain their vast assortment of invalid data items, character encoding failures, incorrect formatting, duplications and truncated data items. In a post last November on the GitHub CoL+ pages I wrote:

Being old and cynical, I can speculate that in the time spent arguing the "politics" of aggregation in recent years, a competent digital librarian or data scientist would have fixed all the CoL issues and would be halfway through GBIF's. But neither of those aggregators employ digital librarians or data scientists, and I'm guessing that CoL+ won't employ one, either.

Monday, September 18, 2017

Guest post: Our taxonomy is not your taxonomy

Bob mesibov The following is a guest post by Bob Mesibov.

Do you know the party game "Telephone", also known as "Chinese Whispers"? The first player whispers a message in the ear of the next player, who passes the message in the same way to a third player, and so on. When the last player has heard the whispered message, the starting and finishing versions of the message are spoken out loud. The two versions are rarely the same. Information is usually lost, added or modified as the message is passed from player to player, and the changes are often pretty funny.

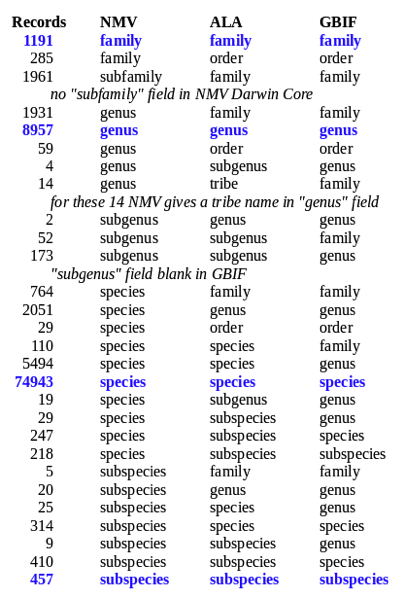
I recently compared ca 100 000 beetle records as they appear in the Museums Victoria (NMV) database and in DarwinCore downloads from the Atlas of Living Australia (ALA) and the Global Biodiversity Information Facility (GBIF). NMV has its records aggregated by ALA, and ALA passes its records to GBIF. The "Telephone" effect in the NMV to ALA to GBIF comparison was large and not particularly funny.

Many of the data changes occur in beetle names. ALA checks the NMV-supplied names against a look-up table called the National Species List, which in this case derives from the Australian Faunal Directory (AFD). If no match is found, ALA generalises the record to the next higher supplied taxon, which it also checks against the AFD. ALA also replaces supplied names if they are synonyms of an accepted name in the AFD.

GBIF does the same in turn with the names it gets from ALA. I'm not 100% sure what GBIF uses as beetle look-up table or tables, but in many other cases their GBIF Backbone Taxonomy mirrors the Catalogue of Life.

To give you some idea of the magnitude of the changes, of ca 85000 NMV records supplied with a genus+species combination, about one in five finished up in GBIF with a different combination. The "taxonRank" changes are summarised in the overview below, and note that replacement ALA and GBIF taxon names at the same rank are often different:

Generalised

Of the species that escaped generalisation to a higher taxon, there are 42 names with genus triples: three different genus names for the same taxon in NMV, ALA and GBIF.

Just one example: a paratype of the staphylinid Schaufussia mona Wilson, 1926 is held in NMV. The record is listed under Rytus howittii (King, 1866) in the ALA Darwin Core download, because AFD lists Schaufussia mona as a junior subjective synonym of Tyrus howitti King, 1866, and Tyrus howittii in AFD is in turn listed as a synonym of Rytus howittii (King, 1866). The record appears in GBIF under Tyraphus howitti (King, 1865), with Rytus howittii (King, 1866) listed as a synonym. In AFD, Rytus howittii is in the tribe Tyrini, while Tyraphus howitti is a different species in the tribe Pselaphini.

ALA gives "typeStatus" as "paratype" for this record, but the specimen is not a paratype of Rytus howittii. In the GBIF download, the "typeStatus" field is blank for all records. I understand this may change in future. If it does, I hope the specimen doesn't become a paratype of Tyraphus howitti through copying from ALA.

There are lots of "Telephone" changes in non-taxonomic fields as well, including some geographical howlers. ALA says that a Kakadu National Park record is from Zambia and another Northern Territory record is from Mozambique, because ALA trusts the incorrect longitude provided by NMV more than it does the NMV-supplied locality text. GBIF blanks this locality text field, leaving the GBIF user with two African records for Australian specimens and no internal contradictions.

ALA trusts latitude/longitude to the extent of changing the "stateProvince" field for localities near Australian State borders, if a low-precision latitude/longitude places the occurrence a short distance away in an adjoining State.

Manglings are particularly numerous in the "recordedBy" field, where name strings are reformatted, not always successfully. Complex NMV strings suffer worst, e.g. "C Oke; Charles John Gabriel" in NMV becomes "Oke, C.|null" in ALA, and "Ms Deb Malseed - Winda-Mara Aboriginal Corporation WMAC; Ms Simone Sailor - Winda-Mara Aboriginal Corporation WMAC" is reformatted as in ALA "null|null|null|null"

Most of the "Telephone" effect in the NMV-ALA-GBIF comparison appears in the NMV-ALA stage. I contacted ALA by email and posted some of the issues on the ALA GitHub site; I haven't had a response and the issues are still open. I also contacted Tim Robertson at GBIF, who tells me that GBIF is working on the ALA-GBIF stage.

Can you get data as originally supplied by NMV to ALA, through ALA? Well, that's easy enough record-by-record on the ALA website, but not so easy (or not possible) for a multi-record download. Same with GBIF, but in this case the "original" data are the ALA versions.

Thursday, August 14, 2014

Seven percent of GBIF data is usable - quick thoughts on Hjarding et al. 2014

Update: Angelique Hjarding and her co-authors have responded in a guest post on iPhylo.

The quality and fitness for use of GBIF-mobilised data is a topic of interest to anyone that uses GBIF data. As an example, a recent paper on African chameleons comes to some rather alarming conclusions concerning the utility of GBIF data:

Hjarding, A., Tolley, K. A., & Burgess, N. D. (2014, July 10). Red List assessments of East African chameleons: a case study of why we need experts. Oryx. Cambridge University Press (CUP). doi:10.1017/s0030605313001427

Here's the abstract (unfortunately the paper is behind a paywall):

The IUCN Red List of Threatened Species uses geographical distribution as a key criterion in assessing the conservation status of species. Accurate knowledge of a species’ distribution is therefore essential to ensure the correct categorization is applied. Here we compare the geographical distribution of 35 species of chameleons endemic to East Africa, using data from the Global Biodiversity Information Facility (GBIF) and data compiled by a taxonomic expert. Data screening showed 99.9%of GBIF records used outdated taxonomy and 20% had no locality coordinates. Conversely the expert dataset used 100%up-to-date taxonomy and only seven records (3%) had no coordinates. Both datasets were used to generate range maps for each species, which were then used in preliminary Red List categorization. There was disparity in the categories of 10 species, with eight being assigned a lower threat category based on GBIF data compared with expert data, and the other two assigned a higher category. Our results suggest that before conducting desktop assessments of the threatened status of species, aggregated museum locality data should be vetted against current taxonomy and localities should be verified. We conclude that available online databases are not an adequate substitute for taxonomic experts in assessing the threatened status of species and that Red List assessments may be compromised unless this extra step of verification is carried out.

The authors used two data sets, one from GBIF, the other provided by an expert to compute the conservation status for each chameleon species endemic to Kenya and/or Tanzania. After screening the GBIF data for taxonomic and geographic issues, a mere 7% of the data remained - 93% of the 2304 records downloaded from GBIF were discarded.

This study raises a number of questions, some of which I will touch on here. Before doing so, it's worth noting that it's unfortunate that neither of the two data sets used in this study (the data downloaded from GBIF, and the expert data set assembled by Colin Tilbury) are provided by the authors, so our ability to further explore the results is limited. This is a pity, especially now that citable data repositories such as Dryad and Figshare are available. The value of this paper would have been enhanced if both datasets were archived.

Below is Table 1 from the paper, "Museums from which locality records for East African chameleons were obtained for the expert and GBIF datasets":

MuseumExpert datasetGBIF
Afrika Museum, The Netherlandsx
American Museum of Natural History, USAx
Bishop Museum, USAx
British Museum of Natural History, UKx
Brussels Museum of Natural Sciences, Belgiumx
California Academy of Sciences, USAx
Ditsong Museum, South Africaxx
Los Angeles County Museum of Natural History, USAx
Museum für Naturkunde, Germanyx
Museum of Comparative Zoology (Harvard University), USAx
Naturhistorisches Museum Wien, Austriax
Smithsonian Institution, USAx
South African Museum, South Africax
Trento Museum of Natural Sciences, Italyx
University of Dar es Salaam, Tanzaniax
Zoological Research Museum Alexander Koenig, Germanyx


It is striking that there is virtually no overlap in data sources available to GBIF and the sources used by the expert. Some of the museums have no presence in GBIF, including some major collections (I'm looking at you, The Natural History Museum), but some museums do contribute to GBIF, but not their herpetology specimens. So, GBIF has some work to do in mobilising more data (Why is this data not in GBIF? What are the impediments to that happening?). Then there are museums that have data in GBIF, but not in a form useful for this study. For example, the American Museum of Natural History has 327,622 herpetology specimens in GBIF, but not one of these is georeferenced! Given that there are records in GenBank for AMNH specimens that are georeferenced, I suspect that the AMNH collection has deliberately not made geographic coordinates available, which raises the obvious question - why?

GBIF coverage


I had a quick look at GBIF to get some idea of the geographic coverage of the relevant herpetology collections (or animal collections if herps weren't separated out). Below are maps for some of these collections. The AMNH is empty, as is the smaller Zoological Research Museum Alexander Koenig collection (which supplied some of the expert data).

American Museum of Natural History, USA

Bishop Museum, USA

California Academy of Sciences, USA

Ditsong Museum, South Africa

Los Angeles County Museum of Natural History, USA

Museum für Naturkunde, Germany

Museum of Comparative Zoology (Harvard University), USA

Smithsonian Institution, USA

Zoological Research Museum Alexander Koenig, Germany


Some collections are relevant, such as the California Academy of Sciences, but a number of the collections in GBIF simply don't have georeferenced data on chameleons. Then there are several museums that are listed as sources for the expert database and which contribute to GBIF, but haven't digitised their herp collections, or haven't made these available to GBIF.

Taxonomy


The other issue encountered by Hjarding et al. 2014 is that the GBIF taxonomy for chameleons is out of date (2302 of 2304 GBIF-sourced records needed to be updated). Chameleons are a fairly small group, and it's not like there are hundreds of new species being discovered each year (see timeline in BioNames), 2006 was a bumper year with 12 new taxonomic names added. But there has been a lot of recent phylogenetic work which has clarified relationships, and as a result species get shuffled around different genera, resulting in a plethora of synonyms. GBIF's taxonomy has lagged behind current research, and also manages to horribly mangle the chameleon taxonomy is does have. For example, the genus Trioceros is not even placed within the chameleon family Chamaeleonidae but is simply listed as a reptile, which means anyone searching for data on the family Chamaeleonidae will all the Trioceros species.

Summary


The use case for this study seems one of the most basic that GBIF should be able to meet - given some distributions of organisms, compute an assessment of their conservation status. That GBIF-mobilised data is so patently not up to the task in this case is cause for concern.

However, I don't see this is simply a case of expert data set versus GBIF data, I think it's more complicated than that. A big issue here is data availability, and also the extent of data release (assuming that the AMNH is actively withholding geographic coordinates for some, if not most of its specimens). GBIF should be asking those museums that provide data why they've not made georeferenced data available, and if its because the museums simply haven't been able to do this, then how can it help this process? It should also be asking why museums which are part of GBIF haven't mobilised their herpetology data, and again, what can it do to help? Lastly, in an age of rapid taxonomic change driven by phylogenetic analysis, GBIF needs to overhaul the glacial pace at which it incorporates new taxonomic information.

Wednesday, February 19, 2014

Five Stages of Data Grief

OdiThere is a great post by Jeni Tennison on the Open Data Institute blog entitled Five Stages of Data Grief. It resonates so much with my experience working with biodiversity data (such as building BioNames, or exploring data errors in GBIF) that I've decide to reproduce it here.

Five Stages of Data Grief

by Jeni Tennison (@JeniT)

As organisations come to recognise how important and useful data could be, they start to think about using the data that they have been collecting in new ways. Often data has been collected over many years as a matter of routine, to drive specific processes or sometimes just for the sake of it. Suddenly that data is repurposed. It is probed, analysed and visualised in ways that haven’t been tried before.

Data analysts have a maxim:

If you don’t think you have a quality problem with your data, you haven’t looked at it yet.

Every dataset has its quirks, whether it’s data that has been wrongly entered in the first place, automated processing that has introduced errors, irregularities that come from combining datasets into a consistent structure or simply missing information. Anyone who works with data knows that far more time is needed to clean data into something that can be analysed, and to understand what to leave out, than in actually performing the analysis itself. They also know that analysis and visualisation of data will often reveal bugs that you simply can’t see by staring at a spreadsheet.

But for the people who have collected and maintained such data — or more frequently their managers, who don’t work with the data directly — this realisation can be a bit of a shock. In our last ODI Board meeting, Sir Tim Berners-Lee suggested that the data curators need to go through was something like the five stages of grief described by the Kübler-Ross model.

So here is an outline of what that looks like.

Denial

This can’t be right: there’s nothing wrong with our data! Your analysis/code/visualisation must be doing something wrong.

At this stage data custodians can’t believe what they are seeing. Maybe they have been using the data themselves but never run into issues with it because they were only using it in limiting ways. Maybe they had only ever been collecting the data, and not actually using it at all. Or maybe they had been viewing it in a form where the issues with data quality were never surfaced (it’s hard to spot additional spaces, or even zeros, when you just look at a spreadsheet in Excel, for example).

So the first reason that they reach for is that there must be something wrong with the analysis or code that seems to reveal issues with the data. There may follow a wild goose chase that tries to track down the non-existent bug. Take heart: this exercise is useful in that it can pinpoint the precise records that are causing the problems in the first place, which forces the curators to stop denying them.

Anger

Who is responsible for these errors? Why haven’t they been spotted before?

As the fact that there are errors in the data comes to be understood, the focus can come to rest on the people who collect and maintain the data. This is the phase that the maintainers of data dread (and can be a reason for resisting sharing the data in the first place), because they get blamed for the poor quality.

This painful phase should eventually result in an evaluation of where errors occur — an evaluation that is incredibly useful, and should be documented and kept for the Acceptance phase of the process — and what might be done to prevent them in future. Sometimes that might result in better systems for data collection but more often than not it will be recognised that some of the errors are legacy issues or simply unavoidable without massively increasing the maintenance burden.

Bargaining

What about if we ignore these bits here? Can you tweak the visualisation to hide that?

And so the focus switches again to the analysis and visualisations that reveal the problems in the data, this time with an acceptance that the errors are real, but a desire to hide the problems so that they’re less noticeable.

This phase puts the burden on the analysts who are trying to create views over the data. They may be asked to add some special cases, or tweak a few calculations. Areas of functionality may be dropped in their entirety or radically changed as a compromise is reached between utility of the analysis and low quality data to feed it.

Depression

This whole dataset is worthless. There’s no point even trying to capture this data any more.

As the number of exceptions and compromises grows, and a realisation sinks in that those compromises undermine the utility of the analysis or visualisation as a whole, a kind of despair sets in. The barriers to fixing the data or collecting it more effectively may seem insurmountable, and the data curators may feel like giving up trying.

This phase can lead to a re-examination of the reasons for collecting and maintaining the data in the first place. Hopefully, this process can aid everyone in reasserting why the data is useful, regardless of some aspects that are lower quality than others.

Acceptance

We know there are some problems with the data. We’ll document them for anyone who wants to use it, and describe the limitations of the analysis.

In the final stage, all those involved recognise that there are some data quality problems, but that these do not render the data worthless. They will understand the limits of analyses and interpretations that they make based on the data, and they try to document them to avoid other people being misled.

The benefits of the previous stages are also recognised. Denial led to double-checking the calculations behind the analyses, making them more reliable. Anger led to re-examination of how the data was collected and maintained, and documentation that helps everyone understand the limits of the data better. Bargaining forced analyses and visualisations to be focused and explicit about what they do and don’t show. Depression helped everyone focus on the user needs from the data. Each stage makes for a better end product.


Of course doing data analysis isn’t actually like being diagnosed with a chronic illness or losing a loved one. There are things that you can do to remedy the situation. So I think we need to add a sixth stage to the five stages of data grief described above:

Hope

This could help us spot errors in the data and fix them!

Providing visualisations and analysis provides people with a clearer view about what data has been captured and can make it easier to spot mistakes, such as outliers caused by using the wrong units when entering a value, or new categories created by spelling mistakes. When data gets used to make decisions by the people who capture the data, they have a strong motivation to get the data right. As Francis Irving outlined in his recent Friday Lunchtime Lecture at ODI, Burn the Digital Paper, these feedback loops can radically change how people think about data, and use computers within their organisations.

Making data open for other people to look at provides lots more opportunities for people to spot errors. This can be terrifying — who wants people to know that they are running their organisation based on bad-quality data? — but those who have progressed through the five stages of data grief find hope in another developer maxim:

Given enough eyeballs, all bugs are shallow.

Linus’s Law, The Cathedral and the Bazaar by Eric Raymond

The more people look at your data, the more likely they are to find the problems within it. The secret is to build in feedback mechanisms which allow those errors to be corrected, so that you can benefit from those eyes and increase your data quality to what you thought it was in the first place.


Friday, September 20, 2013

The quality of GBIF's taxonomic classification

In some recent posts I've been exploring the quality of GBIF's taxonomic data. I've done some further analyses and decided to write this up in something more than a blog post. I'm writing a draft which you can see on GitHub. It tackles just one issue, namely what happens when you combine taxonomic names from multiple sources and don't know that some of those names are synonyms. For example, below is a cluster map for mammal species names from the Catalogue of Life, Mammal Species of the World, and the IUCN Red List.

Mammal species
Each database has a set of names that it and it alone recognises, as well as names that two of the three agree on. Merging these three sets of names successful requires knowing which are synonyms. As I've noted before some synonyms have ended up in GBIF as separate names, which can mean users get a rather distorted view of what GBIF actually knows about a species.

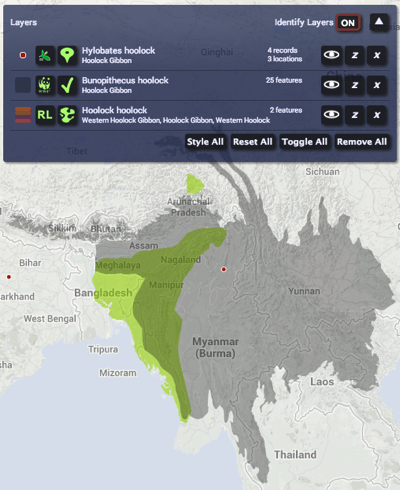
This issue doesn't just affect GBIF, projects like the Map of Life suffer the same problem. The gibbon example I used earlier crops up again. I had to do three separate searches of Map of Life using the three different synonyms for the hoolock gibbon to get a complete picture of our knowledge of its distribution:

Mapoflife
The multiplicity of names for the same taxon is one of the main challenges facing anyone wanting to integrate biodiversity data, and hence this taxonomy meme seems rather appropriate:


Thursday, May 02, 2013

GBIF data quality: visualising Mesibov's millipedes


Bob Mesibov (who has been a guest author on this blog) recently published a paper on data quality in in ZooKeys:

Mesibov, R. (2013). A specialist’s audit of aggregated occurrence records. ZooKeys, 293(0), 1–18. doi:10.3897/zookeys.293.5111

In this paper Bob documents some significant discrepancies between data in his
Millipedes of Australia (MoA) database and the equivalent data in the Atlas of Living Australia and GBIF (disclosure, I was a reviewer of the paper, and also sit on GBIF's science committee). This paper spawned a thread on TAXACOM, and also came up at the GBIF meeting I was at earlier this week.

One thing lacking from the discussion is a clear sense of just how big are the discrepancies between GBIF and MoA data, so I grabbed the data provided by Bob (http://dx.doi.org/10.3897/zookeys.293.5111.app and extracted the records where GBIF and MoA disagreed. I converted these to GeoJSON and threw them on Google Maps:

Mesibov2

You can see a live version here http://bl.ocks.org/rdmpage/raw/5501293/ (it can take a little while for the map to appear). I've connected the MoA and GBIF localities for the same occurrence by a straight line, and the the MoA records are encircled by an estimate of their uncertainty (for many records the circle is invisible at this scale).

There are some fairly spectacular discrepancies, and a lot of relatively small scale displacements of records. Does this matter? The answer to this question will depend on what people want to do with the data. You may regard the discrepancies as serious (certainly it's interesting that there are so many differences between the two data sets), or minor given the geographic scale. But visualising them at least makes it possible to form a judgement.

Monday, September 28, 2009

Google Scholar metadata quality and Mendeley hype

Hot on the heels of Geoffrey Nunberg's essay about the train wreck that is Google books metadata (see my earlier post) comes Google Scholar’s Ghost Authors, Lost Authors, and Other Problems by Péter Jacsó. It's a fairly scathing look at some of the problems with the quality of Google Scholar's metadata.

Now, Google Scholar isn't perfect, but it's come to play a key role in a variety of bibliographic tools, such as Mendeley, and Papers. These tools do a delicate dance with Google Scholar who, strictly speaking, don't want anybody scraping their content. There's no API, so Mendeley, Papers (and my own iSpecies) have to keep up with the HTML tweaks that Google introduces, pretend to be web browsers, fuss with cookies, and try to keep the rate of queries below the level at which the Google monster stirs and slaps them down.

Jacsó's critique also misses the main point. Why do we have free (albeit closed) tools like Google Scholar in the first place? It's largely because scientists have ceeded the field of citation analysis to commercial companies, such as Elsevier and Thompson Reuters. To echo Martin Kalfatovic's comment:
Over the years, we've (librarians and the user community) have allowed an important class of metadata - specifically the article level metadata - migrate to for profit entities.
Some visionaries, such as Robert Cameron in his A Universal Citation Database as a Catalyst for Reform in Scholarly Communication, argued for free, open citation databases, but this came to nought.

For me, this is the one thing the ridiculously over-hyped Mendeley could do that would merit the degree of media attention it is getting -- be the basis of an open citation database. It would need massive improvement to its metadata extraction algorithms, which currently suck (Google Scholar's, for all Jacsó's complaints, are much better), but it would generate something of lasting value.


Saturday, September 19, 2009

Biodiversity Heritage Library, Google books, and metadata quality

I've been playing recently with the Biodiversity Heritage Library (BHL), and am starting to get a sense for the complexities (and limitations) of the metadata BHL stores about publications. The more I look at BHL the more I think the resource is (a) wonderfully useful and (b) hampered by some dodgy metadata.

The BHL data model has three kinds of entities, "Titles", "Items", and "Pages". Pages are individual pages in an item, where an item which corresponds to a physical object that has been scanned (such as a book or a bound volume of a journal). A title may comprise a single item, such as book, or many items, such as volumes of a journal. Most of the metadata BHL has relates to physical items (books and bound volume issues), as opposed to article-level metadata, which is basically absent (see But where are the articles?).

bhl_model.png


This model reflects the sources of the BHL metadata (library catalogues) and the mode of operation (bulk scanning of bound volumes). But it can make working out dates of somewhat challenging.

To give an example, I did a search on the frog name Hyla rivularis Taylor, 1952 (NameBankID 27357), currently known as Isthmohyla rivularis. I wanted to find the original description of this frog. A BHL search returns 34 pages containing the name Hyla rivularis, distributed over 5 titles (a title in BHL may be a book, or a journal). Given that the name was published in 1952, it would be nice if I could sort these results by date, and then look at items from 1952. Unfortunately I can't. BHL has limited information on dates, especially at the level I would need to find a document published in 1952.

For the five titles returned in the search, I have dates for four of them, albeit two are ranges (University of Kansas publications, Museum of Natural History, 1946-1971, and The University of Kansas science bulletin, 1902-1996). At the level of individual items, only item 25858 (University of Kansas publications, Museum of Natural History) has dates (1961-1966). If I look at the VolumeInfo field for an item (you can get this from the database dump, or using the JSON web service) I sometimes get strings like this "v.35:pt.1 (1952)". This item (25857) is the one I'm after, but the date is buried in the VolumeInfo string. So, the information I need is there, but it's going to need some parsing.

84203b53fc75bd5bbc7f6a62fe8500f1.jpeg

Another issue is that of duplicates. Searching for publications on Rana grahamii, I found items 41040 and 45847. Although one item is treated as a book, and the other as a volume of the journal Records of the Indian Museum, these are the same thing. Having duplicates is a complication, but it might also be useful for quality control and testing (for example, do taxon name extraction algorithms return the same names from OCR text from both copies?). Nor is having duplicate copies and/or identifiers unique to BHL. The Records of the Indian Museum has a series-level identifier (ISSN 0537-0744), and this article ("A monograph of the South Asian, Papuan, Melanesian and Australian frogs of the genus Rana") also as the ISBN 8121104327.

There are parallels with Google books scanning project, which has been the subject of criticism on several fronts, including the quality of the metadata they have for each book. Geoff Nunberg has an entertaining post entitled Google Books: A Metadata Train Wreck which lists many examples of errors. This blog post also contains a detailed response from Jon Orwant of Google books. In essence, Google books is riddled with metadata errors (such as books on the Internet with publication dates predating the birth of their authors), but most of these errors have come from library catalogues (not unexpected given the scale of the task), not Google.

What could BHL do about its metadata? One thing is crowdsourcing. BHL does a little of this already, for example capturing user-provided metadata when PDFs are created, but I wonder if we could do more. For example, imagine dumping metadata for all 39,000 items into a semantic wiki and inviting people to edit and annotate the metadata. This could be extended to adding article boundaries (i.e., identifying which page corresponds to the start of an article). There is also considerable scope for trying to find article boundaries using existing metadata from bibliographies assembled by individual scientists.

But we should watch closely what Google does with its book project. Eric Hellman has argued that, far from creating the metadata mess, Google is ideally positioned to sort it out. He writes:
What if Google, with pseudo-monopoly funding and the smartest engineers anywhere, manages to figure out new ways to separate the bird shit from the valuable metadata in thousands of metadata feeds, thereby revolutionizing the library world without even intending to do so?