Rants, raves (and occasionally considered opinions) on phyloinformatics, taxonomy, and biodiversity informatics. For more ranty and less considered opinions, see my Twitter feed. ISSN 2051-8188. Written content on this site is licensed under a Creative Commons Attribution 4.0 International license.
Notes on how many georeferenced DNA sequences there are in GenBank, and how many could potentially be georeferenced.
BCT	Bacterial sequences
PRI	Primate sequences
ROD	Rodent sequences
MAM	Other mammalian sequences
VRT	Other vertebrate sequences
INV	Invertebrate sequences
PLN	Plant and Fungal sequences
VRL	Viral sequences
PHG	Phage sequences
RNA	Structural RNA sequences
SYN	Synthetic and chimeric sequ
UNA	Unannotated sequences
https://eutils.ncbi.nlm.nih.gov/entrez/eutils/esearch.fcgi
?db=nucleotide nucleotides
&term=ddbj embl genbank with limits[filt]
NOT transcriptome[All Fields] ignore transcriptome data
NOT mRNA[filt] ignore mRNA data
NOT TSA[All Fields] ignore TSA
NOT scaffold[All Fields] ignore scaffold
AND src lat lon[prop] include records that have source feature "lat_lon"
AND 2010/01/01:2010/12/31[pdat] from this date range
AND gbdiv_pri[PROP] restrict search to PRI division (primates)
AND srcdb_genbank[PROP] Need this if we query by division, see NBK49540
Numbers of nucleotide sequences that have latitude and longitudes in GenBank for each year.
Date
PRI
ROD
MAM
VRT
INV
PLN
2010/01/01
4
127
2552
9551
92692
7174
2011/01/01
371
1204
8160
17657
78494
7968
2012/01/01
6
5803
4214
21696
84060
27314
2013/01/01
297
349
761
10764
70411
23435
2014/01/01
15
2904
4761
14598
68076
14018
2015/01/01
174
527
1983
17843
363538
35501
2016/01/01
58
2615
1263
14898
757893
22813
2017/01/01
938
1758
1017
10712
75066
28180
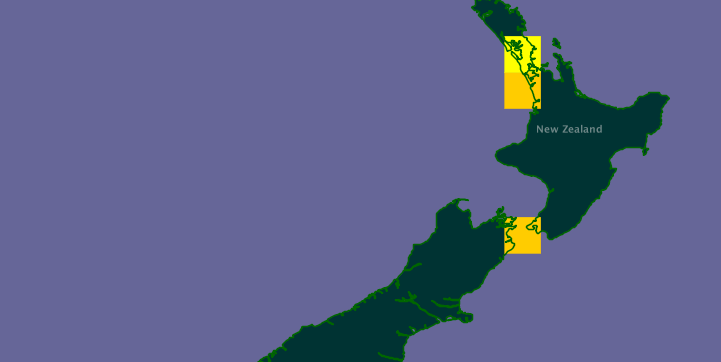
Numbers of nucleotide sequences that don't have latitude and longitudes in GenBank for each year but do have the country field and hence could be georeferenced.
Note to self for upcoming discussion with JournalMap.
As of Monday August 25th, BioStor has 106,617 articles comprising 1,484,050 BHL pages. From the full text for these articles, I have extracted 45,452 distinct localities (i.e., geotagged with latitude and longitude). 15,860 BHL pages in BioStor pages have at least one geotag, these pages belong to 5,675 BioStor articles.
For example, here's a simple interface to edit the location of a specimen or observation (inspired by the iNaturalist observation editor). You can play with this below or on on bl.ocks.org, and the source code is on GitHub https://gist.github.com/rdmpage/9951904.
Every so often I revisit the idea of browsing a collection of documents (or specimens, or phylogenies) geographically. It's one thing to display a map of localities for single document (as I did most recently for Zootaxa), it's quite another to browse a large collection.
Today I finally bit the bullet and put something together, which you can see at http://biostor.org/maps/. The website comprises a Google Map showing localities extracted from papers in BioStor, and a list of the papers that have one or more points visible on the map.
In building this I hit a few obstacles. The first is the number of localities involved. I've extracted several thousand point localities from articles in BioStor. Displaying all these on a Google Map is going to be tedious. Fortunately, there's a wonderful library called MarkerCluster, part of the google-maps-utility-library-v3 that handles this problem. MarkerCluster cluster together markers based on zoom level. If you zoom out the markers cluster together, as you zoom in these clusters will start to resolve into their component points. Very, very cool.
The second challenge was to have the list of references update automatically as we move around or zoom in and out on the map. To do this I need to know the bounding box currently being displayed in the map, I can then query the MySQL database underlying BioStor for the localities within the bounding box, using MySQL's spatial extensions. The query is easy enough to implement using ajax, but the trick was knowing when to call it. Initially, listening for the bounds_changed event seemed a good idea. However, this event is fired as the map is being moved (i.e., if the user is panning or dragging the map a whole series of bounds_changed events are fired), whereas what I want is something that signals that the user has stopped moving the map, at which point I can query the database for articles that correspond to the region that map is currently displaying. Turns out that the event I need to listen for is idle (see Issue 1371: map.bounds_changed event fires repeatedly when the map is moving), so I have a function that captures that event and loads the corresponding set of articles.
Another "gotcha" occurs when the region being viewed crosses longitude 180° (or -180°) (see diagram below from http://georss.org/Encodings).
In this case the polygon used to query MySQL would be incorrectly interpreted, so I create two polygons, each with 180° or -180° as one of the boundaries, and merge the articles with points in either of those two polygons.
I've made a short video showing the map in action. Although I've implemented this for BioStor, the code is actually pretty generic, and could easily be adapted to other cases where we want to navigate through a set of objects geographically.
I'm in the midst of rebuilding iSpecies (my mash-up of Wikipedia, NCBI, GBIF, Yahoo, and Google search results) with the aim of outputting the results in RDF. The goal is to convert iSpecies from a pretty crude "on-the-fly" mash-up to a triple store where results are cached and can be queried in interesting ways. Why? Partly because I think such a triple store is an obvious way to underpin a "biodiversity hub" of the kind envisaged by PLoS (see my earlier post).
As ever, once one embarks down the RDF route (and I've been here before), one hits all the classic stumbling blocks, such as "what URI do I use for a thing?", and "what vocabulary do I use to express relationships between things?". For example, I'd like to represent the geographic distribution of a taxon as depicted on a GBIF map. How do I describe this in a RDF document?
To make this concrete, take one of my favourite animals, the New Zealand mud crab Helice crassa. Here's the GBIF map for this taxon:
(or http://bit.ly/cuTFW9, if you prefer). Now, there's no way I'm using this URL! Plus, the URL identifies an image, not the distribution.
But, if we look at the map we see that it is made of 1° × 1° squares. If each of those had a URI then I could simply list those squares as the distribution of the crab. This seems straightforward as GBIF has a service that provides these squares. For example, the URL http://data.gbif.org/species/17462693 (where 17462693 corresponds to Helice crassa) returns:
These are the 1° × 1° squares for which there are records of Helice crassa. Now, what I'd like to do is have a URI for each square, and I'd like to do this without reinventing the wheel. I've come across a URI space for points of the globe (the WGS 84 Geographic Point URI Space"), but not one for polygons. Then it dawned on me that perhaps c-squares, developed by Tony Rees at the CSIRO in Australia, would do the trick1. To quote Tony:
C-squares is a system for storage, querying, display, and exchange of "spatial data" locations and extents in a simple, text-based, human- and machine- readable format. It uses numbered (coded) squares on the earth's surface measured in degrees (or fractions of degrees) of latitude and longitude as fundamental units of spatial information, which can then be quoted as single squares (similar to a "global postcode") in which one or more data points are located, or be built up into strings of codes to represent a wide variety of shapes and sizes of spatial data "footprints".
C-squares appeal partly (and this says nothing good about me) because they have a slightly Byzantine syntax. However, they are short, and quite easy to calculate. I'll let the reader find out the gory details. To give an example, my home town, Auckland, has latitude -36.84, longitude 174.74, which corresponds to the 1° × 1° c-square with the code 3317:364.
Now, all I need to do is convert c-squares into URIs. If you append the c-square to http://bioguid.info/csquare:, like this, http://bioguid.info/csquare:3317:364, you get a linked data-friendly URI for the c-square. In a web browser you get a simple web page like this:
Now, I can refer to each square by it's own URI. This will also enable me to query a triple store by c-square (e.g., what other taxa occur within this 1° × 1° square?).
Tony Rees had emailed me about this in response to a tweet about URIs for co-ordinates, but it took me a while to realise how useful c-square notation could be.
AS a first step I've added a Wikispecies RSS feed to my list of RSS feeds. This feed takes the original Wikispecies RSS feed for new pages (generated by the page Special:NewPages) and tries to extract some details before reformatting it as an ATOM feed. Specifically, I extract GUIDs such as IPNI and Index Fungorum identifiers, bibliographic references (which I will later parse to try and extract identifiers such as DOIs), and latitude and longitude if the Wikispecies page has type locality information. Having the later means that the RSS feed can be displayed as a map (Google Maps can take a RSS feed with geotagged items and display it on a map for you).
The map below is live, so it will show any geotagged items in the current Wikispecies feed.
Prepare and present a real-time demonstration during the days of the Conference of the capabilities in your community of practice to discover, disseminate, integrate, and explore new biodiversity-related data by:
Capturing data in private and public databases;
Conducting quality assurance on the data by automated validation and/or peer review;
Indexing, linking and/or automatically submitting the new data records to other relevant databases;
Integrating the data with other databases and data streams;
Making these data available to relevant audiences;
Make the data and links to the data widely accessible; and
Offering interfaces for users to query or explore the data.
Originally I planned to enter the wiki project I've been working on for a while, but time was running out and the deadline was too ambitious. Hence, I switched to thinking about RSS feeds. The idea was to first create a set of RSS feeds for sources that lack them, which I've been doing over at http://bioguid.info/rss, then integrate these feeds in a useful way. For example, the feeds would include images from Flickr (such as EOL's pool), geotagged sequences from GenBank, the latest papers from Zootaxa, and new names from uBio (I'd hoped to include ION as well, but they've been spectacularly hacked).
After playing with triple stores and SPARQL (incompatible vocabularies and multiple identifiers rather buggers this approach), and visualisations based on Google Maps (building on my swine flu timemap), it dawned on me what I really needed was an eye-catching way of displaying geotagged, timestamped information, just like David Troy's wonderful twittervision and flickrvision.com. In particular, David took the Poly9 Globe and added Twitter and Flickr feeds (see twittervision 3D and flickrvision 3D. So, I took hacked David's code and created this, which you can view at http://bioguid.info/ebio09/www/3d/:
It's a lot easier to simply look at it rather than describe what it does, but here's a quick sketch of what's under the hood.
Firstly, I take RSS feeds, either the raw geoFeed from Flickr, or from http://bioguid.info/rss. The bioGUID feeds include the latest papers in Zootaxa (most new animal species are described in this journal), a modified version of uBio's new names feed, and a feed of the latest, geotagged sequences in GenBank (I'd hoped to use only DNA barcodes, but it turns out rather few barcode sequences are geotagged, and few have the "BARCODE" keyword). The Flickr feeds are simple to handle because they include locality information (including latitude, longitude, and Yahoo Where-on-Earth Identifiers (WOEIDs)). Similarly, the GenBank feed I created has latitude and longitudes (although extracting this isn't always as straightforward as it should be). Other feeds require more processing. The uBio feed already has taxonomic names, but no geotagging, so I use services from Yahoo! GeoPlanet™ to find localities from article titles. For the Zootaxa feed that I created I use uBio's SOAP service to extract taxonomic names, and Yahoo! GeoPlanet™ to extract localities.
I've tried to create a useful display popup. For Zootaxa papers you get a thumbnail of the paper, and where possible an icon of the taxonomic group the paper talks about (the presence of this icon depends on the success of uBio's taxonomic name finding service, the Catalogue of Life having the same name, and my having a suitable icon). The example above shows a paper about copepods. Other papers have a icon for the journal (again, a function of my being able to determine the journal ISSN and having a suitable icon). Flickr images simply display a thumbnail of the image.
What does it all mean? Well, I could say all sorts of things about integration and mash-ups but, dammit, it's pretty. I think it's a fun way to see just what is happening in digital biodiversity. I've deliberately limited the demo to items that came online in the month of May, and I'll be adding items during the conference (June 1-3rd in London). For example, if any more papers appear in Zootaxa, or in the uBio feeds I'll add those. If anybody uploads geotagged photos to EOL's Flickr group, I'll grab those as well. It's still a bit crude, but it shows some of the potential of bringing things together, coupled with a nice visualisation. I welcome any feedback.
One advantage of flying to the US is the chance to do some reading. At Newark (EWR) I picked up Guy Kawasaki's "Reality Check", which is a fun read. You can get a flavour of the book from this presentation Guy gave in 2006.
While at MIT for the Elsevier Challenge I was browsing in the MIT book shop and stumbled across "Google and the Myth of Universal Knowledge" by Frenchman Jean-Noël Jeanneney. It's, um, very French. I have some sympathy with his argument, but ultimately it comes across as European whining about American success. And the proposed solution involves that classic European solution -- committees! In many ways it's really a librarian complaing about Google (again), which librarians just need to get over:
OK, I'm not really doing the arguments justice, but I'm getting a little tired of European efforts that are essentially motivated by "well the Americans are doing this, so we need to do something as well." Lastly, I also bought Linda Hill's "Georeferencing: The Geographic Associations of Information", which is a little out of date (what, no Google Maps or Google Earth?), but is nevertheless an interesting read, and has lots of references to georeferencing in biodiversity informatics. Given that my efforts for the challenge in this area where so crude, it's something I need to think about a bit more deeply.
D. Ross Robertson has published a paper entitled "Global biogeographical data bases on marine fishes: caveat emptor" (doi:10.1111/j.1472-4642.2008.00519.x - DOI is broken, you can get the article here). The paper concludes:
Any biogeographical analysis of fish distributions that uses GIS data on marine fishes provided by FishBase and OBIS 'as is' will be seriously compromised by the high incidence of species with large-scale geographical errors. A major revision of GIS data for (at least) marine fishes provided by FishBase, OBIS, GBIF and EoL is essential. While the primary sources naturally bear responsibility for data quality, global online providers of aggregated data are also responsible for the content they serve, and cannot side-step the issue by simply including generalized disclaimers about data quality. Those providers need to actively coordinate, organize and effect a revision of GIS data they serve, as revisions by individual users will inevitably lead to confused science (which version did you use?) and a tremendous expenditure of redundant effort. To begin with, it should be relatively easy for providers to segregate all data on pelagic larvae and adults of marine organisms that they serve online. Providers should also include the capacity for users to post readily accessible public comments about the accuracy of individual records and the overall quality of individual data bases. This would stimulate improvements in data quality, and generate 'selection pressures' favouring the usage of better quality data bases, and the revision or elimination of poor-quality data bases. The services provided to the global science community by the interlinked group of online providers of biodiversity data are invaluable and should not be allowed to be discredited by a high incidence of known serious errors in GIS data among marine fishes, and, likely, other marine organisms. (emphasis added)
As I've noted elsewhere on this blog, and as demonstrated by Yesson et al.'s paper on legume records in GBIF (doi:10.1371/journal.pone.0001124) (not cited by Robertson), there are major problems with geographical information in public databases. I suspect there will be more papers like this, which I hope will inspire database providers and aggregators to take the issue seriously. (Thanks to David Patterson for spotting this paper).
The more I play with GBIF the more I come across some spectacular errors. Here's one small example of what can go wrong, and how easy it would be to fix at least some of the errors in GBIF. This is topical given that the recent review of EOL highlighted the importance of vetting and cleaning data.
Oops, the frog is found in the middle of the South Atlantic(!), and in Brazil(!?). These specimen records are provided by the MCZ, Harvard. Looking at the latitude and longitude co-ordinates, it's clear that there has been a comedy of errors. In the case of MCZ A-119852 the longitude is west instead of east, for MCZ A-119850 and MCZ A-119851 the latitude and longitudes have been swapped, and the longitude is west instead of east (again). If we make these changes, the specimens go back to Madagascar (the rectangle on the SVG map below). If you don't see the map, use a decent web browser such as Safari 3 or Firefox 2. If you must use Internet Explorer, grab the RENESIS player.
Interestingly the DiGIR records all list the country as Madagascar, so for any specimen in GBIF it would be trivial to test whether:
do the co-ordinates for the specimen fall inside the bounding box for the country?
if not, will they if we change sign (i.e., hemispheres) and/or swap latitude and longitude?
These would be trivial things to do, and would probably catch a lot of the more egregious errors in GBIF.
Fixing errors What will be interesting is whether these records will be fixed. I have sent feedback via GBIF's web site, as well as sending an email to the MCZ. I'll let readers know what happens.
Ground truth
Lastly, those interested in the frog itself may find the iSpecies search frustrating as the link returned by Google Scholar leads to a page in Ingenta saying:
This title is now published by Blackwell Publishing and can be found here www.ingentaconnect.com/content/bsc/zoj
Nope, the paper in question is actually at ScienceDirect (doi:10.1006/zjls.1995.0040). This paper describes the species, and gives the latitude and longitude of the collection localities (correctly).
I started this blog with the goal of documenting my own efforts to make a database of evolutionary trees, based on ideas sketched in hdl:10.1038/npre.2007.1028.1. I've felt that the major task is link phylogenies to other information, such as taxon names, specimens, localities, images, publications, etc. That is, to embed trees in a broader context. Discovering how to engage with that broader context led to a bunch of experiments, toys, and diversions:
iSpecies, a toy to aggregate information on a species.
Semant, experiments with RDF and triple stores (AKA the Semantic Web).
bioGUID, an attempt to make identifiers resolvable, with an increasing focus on developing an OpenURL resolver for biodiversity literature.
iSpecies and bioGUID are still operational, but the ant work fell victim to server crashes, and a growing frustration with the limitations of triple stores. Blogs for all three projects document their histories: iSpecies, Semant, and bioGUID. In a sense, these blogs document the steps along the way to iPhylo.
Based on this experience, I started again with what I've previously referred to as a database of everything. The first public demo is online at iphylo.org/~rpage/demo1. It's very crude, but may give a sense of what I'm trying to do.
The goal of iPhylo is to treat biodiversity objects as equal citizens. Each object has a unique identifier, associated metadata, and is linked to other objects (for example, a specimen is linked to sequences, sequences are linked to publications, etc.). By following the links it is possible to generate new views on existing information, such as a map for study that doesn't have any maps. For example, below is a map generated for Brady et al. (doi:10.1073/pnas.0605858103), based on links between sequences and specimens (if you can't see the map you need a SVG-capable web browser, such as Safari 3 or Firefox 2).
Ironically there are no phylogenies yet. At this stage I'm trying to link the bits together.
How does it work? More on this later. Briefly, iPhylo uses a entity-attribute-value model database to store objects and their relationships. Like bioGUID, iPhylo relies on a suite of web services (most external, some I've developed locally) to locate and resolve identifiers. iPhylo resolves identifiers for PubMed records, GenBank sequences, museum specimens, publications, etc. and adds the associated metadata to a local database. Wherever possible it resolves any links in the metadata (e.g., if a GenBank record mentions a specimen, iPhylo will try and retrieve information on that specimen). When you view an object in iPhylo, these links are displayed. iPhylo will also try and convert bibliographic records to identifiers (such as DOIs) if no identifiers are provided, and also extracts georeferences for specimens and sequences, either from original records or by using a georeferencing service. Taxonomic names are resolved using uBio, and are treated as "tags."
At present iPhylo is being populated by various scripts, there is no facility for users to add data. This is something I will add in the future.
Getting the data One of the biggest challenges is getting data (or, to be more precise, figuring out how to harvest available data). iPhylo builds on code for bioGUID. I've also been exploring bulk harvesting data sources. Sometimes this is easy. Many sequences in Genbank are linked to records in PubMed, so if you know the Pubmed id for a paper, you can harvest the sequences. For example, even though the Bulletin of the American Museum of Natural History isn't indexed in PubMed, it is possible to retrieve all the sequences GenBank records as being from papers published in the Bulletin. You can retrieve this list in XML form by clicking here.
Why?
There are all sorts of things which could be done with this. For example, by linking objects together we can also track the provenance of data, and ultimately build "citation networks" of specimens, sequences, etc. For background see my paper on "Biodiversity informatics: the challenge of linking data and the role of shared identifiers" (doi:10.1093/bib/bbn022, preprint at hdl:10101/npre.2008.1760.1).
As mentioned above, we can generate maps even if the original study didn't include one (by following the links). Given that we can geotag studies, this opens up the possibility to query studies spatially. For example, this study on bats and this study on rodents deal with taxa with very similar distributions. A spatial query could find these easily. Imagine interested in, say, Madagascar, and being able to find phylogenetic studies , even if the title and abstract of the paper don't mention Madagascar by name.
There also potential to clean data. One of the first studies I uploaded is Grant et al.'s study of dart-poison frogs. The map for this study shows a outlying point in California:
This point is MVZ 199828, which is a specimen of the salamander Aneides flavipunctatus. In GenBank, MVZ 199828 is listed as the voucher for seven sequences from the frog Mannophryne trinitatis. Oops. A quick iSpecies search, and a click on the GBIF map reveals that there is a specimen MVZ 199838 of Mannophryne trinitatis. i suspect that this is the true voucher for these sequences, and the GenBank records contain a typo.
Future This is all still very, very crude. The demo is slow, the queries aren't particularly clever, and I've probably gone overboard on using Javascript to populate the web pages. The real value isn't in the web pages, but the links between the data objects. This is my main focus -- extracting and adding links. For now the data is displayed but you can't edit it. However, this is coming. Very basic RDF and RSS feeds are available for each object, and fans of microformats will find some goodies, and sociologists of science may find some of the coauthorship graphs intriguing
Interesting paper in PLoS ONE (doi:10.1371/journal.pone.0001124) on the quality of data housed in GBIF. The study looked at 630,871 georeferenced legume records in GBIF, and concluded that 84% of these records are valid. As examples of those that aren't, below is a map of legumes placed in the sea (there are no marine legumes). Although the abstract warns of the dire consequences of data deficencies, the conclusions make for interesting reading:
The GBIF point data are largely correct: 84% passed our conservative criteria. A serious problem is the uneven coverage of both species and areas in these data. It is possible to retrieve large numbers of accurate data points, but without appropriate adjustment these will give a misleading view of biodiversity patterns. Coverage associates negatively with species richness. There is a need to focus on databasing mega-diverse countries and biodiversity hotspots if we are to gain a balanced picture of global biodiversity. A major challenge for GBIF in the immediate future is a political one: to negotiate access to the several substantial biodiversity databases that are not yet publicly and freely available to the global science community. GBIF has taken substantial steps to achieve its goals for primary data provision, but support is needed to encourage more data providers to digitise and supply their records.
 Note to self for upcoming discussion with