Showing posts with label phylogeny. Show all posts

Wednesday, May 11, 2022

Thoughts on TreeBASE dying(?)

So it looks like TreeBASE is in trouble, it's legacy Java code a victim of security issues. Perhaps this is a chance to rethink TreeBASE, assuming that a repository of published phylogenies is still considered a worthwhile thing to have (and I think that question is open).

Here's what I think could be done.

  1. The data (individual studies with trees and data) are packaged into whatever format is easiest (NEXUS, XML, JSON) and uploaded to a repository such as Zenodo for long term storage. They get DOIs for citability. This becomes the default storage for TreeBASE.
  2. The data is transformed into JSON and indexed using Elasticsearch. A simple web interface is placed on top so that people can easily find trees (never a strong point of the original TreeBASE). Trees are displayed natively on the web using SVG. The number one goal is for people to be able to find trees, view them, and download them.
  3. To add data to TreeBASE the easiest way would be for people to upload them direct to Zenodo and tag them "treebase". A bot then grabs a feed of these datasets and adds them to the search engine in (1) above. As time allows, add an interface where people upload data directly, it gets curated, then deposited in Zenodo. This presupposes that there are people available to do curation. Maybe have "stars" for the level of curation so that users know whether anyone has checked the data.

There's lots of details to tweak, for example how many of the existing URLs for studies are preserved (some URL mapping), and what about the API? And I'm unclear about the relationship with Dryad.

My sense is that the TreeBASE code is very much of its time (10-15 years ago), a monolithic block of code with SQL, Java, etc. If one was starting from scratch today I don't think this would be the obvious solution. Things have trended towards being simpler, with lots of building blocks now available in the cloud. Need a search engine? Just spin up a container in the cloud and you have one. More and more functionality can be devolved elsewhere.

Another other issue is how to support TreeBASE. It has essentially been a volunteer effort to date, with little or no funding. One reason I think having Zenodo as a storage engine is that it takes care of long term sustainability of the data.

I realise that this is all wild arm waving, but maybe now is the time to reinvent TreeBASE?

Updates

It's been a while since I've paid a lot of attention to phylogenetic databases, and it shows. There is a file-based storage system for phylogenies phylesystem (see "Phylesystem: a git-based data store for community-curated phylogenetic estimates" https://doi.org/10.1093/bioinformatics/btv276) that is sort of what I had in mind, although long term persistence is based on GitHub rather than a repository such as Zenodo. Phylesystem uses a truly horrible-looking JSON transformation of NeXML (NeXML itself is ugly), and TreeBASE also supports NeXML, so some form of NeXML or a JSON transformation seems the obvious storage format. It will probably need some cleaning and simplification if it is to be indexed easily. Looking back over the long history of TreeBASE and phylogenetic databases I'm struck by how much complexity has been introduced over time. I think the tech has gotten in the way sometimes (which might just be another way of saying that I'm not smart enough to make sense of it all.

So we could imagine a search engine that covers both TreeBASE and Open Tree of Life studies.

Basic metadata-based searches would be straightforward, and we could have a user interface that highlights the trees (I think TreeBASE's biggest search rival is a Google image search). The harder problem is searching by tree structure, for which there is an interesting literature without any decent implementations that I'm aware of (as I said, I've been out of this field a while).

So my instinct is we could go a long way with simply indexing JSON (CouchDB or Elasticsearch), then need to think a bit more cleverly about higher taxon and tree based searching. I've always thought that one killer query would be not so much "show me all the trees for my taxon" but "show me a synthesis of the trees for my taxon". Imagine a supertree of recent studies that we could use as a summary of our current knowledge, or a visualisation that summarises where there are conflicts among the trees.

Relevant code and sites

Sunday, August 20, 2017

Notes on displaying big trees using Google Maps/Leaflet

Notes to self on web map-style tree viewers. The basic idea is to use Google Maps or Leaflet to display a tree. Hence we need to compute tiles. One approach is to use a database that supports spatial queries to store the x,y coordinates of the tree. When we draw a tile we compute the coordinates of that tile, based on position and zoom level, do a spatial query to extract all lines that intersect with the rectangle for that tile, and draw those.

A nice example of this is Lifemap (see also De Vienne, D. M. (2016). Lifemap: Exploring the Entire Tree of Life. PLOS Biology, 14(12), e2001624. doi:10.1371/journal.pbio.2001624).

It occurs to me that for trees that aren't too big we could do this without an external database. For example, what if we used a Javascript implementation of an R-tree, such as imbcmdth/RTree or its fork leaflet-extras/RTree. So, we could compute the coordinates of the nodes in the tree in "geographic" space, store the bounding box for each line/arc in an R-tree, then query that R-tree for lines that intersect with the bounding box of the relevant tile. We could use a clipping algorithm to only draw the bits of the lines that cross the tile itself.

Web maps, at least in my experience, make trips to a tile server to fetch a tile, we would want instead to call a routine within our web page, because all the data would be loaded into that page. So we'd need to modify the tile creating code.

The ultimate goal would be to have a single page web app that accepts a Newick-style tree and converts into a browsable, zoomable visualisation.

Tuesday, May 10, 2016

Notes on next steps for the million DNA barcodes map

Some notes to self about future directions for the "million DNA barcodes map" http://iphylo.org/~rpage/bold-map/.

Screenshot 2016 05 10 13 52 09

At the moment we have an interactive map that we can pan and zoom, and click on a marker to get a list of one or more barcodes at the location. We can also filter by major taxonomic group. Here are some ideas on what could be next.

Search

At the moment search is simply browsing the map. It would be handy to be able to enter a taxon or a barcode identifier and go to the corresponding markers on the map.

What is this?

If we have a single DNA barcode I immediately want to know "what is this?" A picture may help, and I may look up the scientific name in BioNames, but perhaps the most obvious thing to do is get a phylogeny for that barcode and similar sequences. These could then be displayed on the map using the technique I described in Visualising Geophylogenies in Web Maps Using GeoJSON (see also http://dx.doi.org/10.1371/currents.tol.8f3c6526c49b136b98ec28e00b570a1e).

So, ideally we would:

  1. Display information about that barcode (e.g., taxonomic identification where known).
  2. Display the local phylogeny of barcodes that contains this barcode.
  3. Display that phylogeny on the map
Hence we need to be able to generate a local phylogeny of barcodes, either on the fly (retrieve similar sequences then build tree) or using a precompute global barcode phylogeny from which we pull out the local subtree.

What is there?

A question that the map doesn't really answer is "what is the diversity of a given area?". Yes there are lots of dots, and you can click on them, but what would be nice is the ability to draw a polygon on the map (like this) and get a summary of the phylogenetic diversity of barcodes within that area.

100144 drummondFor example, imagine drawing a polygon around Little Barrier Island in New Zealand. Can we effectively retrieve the data published by Drummond et al. ( Evaluating a multigene environmental DNA approach for biodiversity assessment DOI:10.1186/s13742-015-0086-1)?.

To support "what is there?" queries we need to be able to:

  1. Draw an arbitrary spatial region region on the map and retrieve a set of sequences found within that region
  2. Retrieve the phylogeny for that set of sequences
Once agin, we either need to be able to build a phylogeny for an arbitrary set of sequences on the fly, or extract a subtree. If the a global tree is available, we could compute the length of the subtree, and also compute a visual layout fairly easily (essentially with time proportional to the number of sequences).

We'd also need to decide on the best way to visualise the phylogeny for the set of sequences. Perhaps something like Krona, or something more traditional.

Screen phymmbl

Summary

There doesn't seme to be any way of getting away from the need for a global phylogeny of COI DNA barcodes if I want to extend the functionality of the map.

Wednesday, September 23, 2015

Visualising big phylogenies (yet again)

Inspired in part by the release of the draft tree of life (doi:10.1073/pnas.1423041112 by the Open Tree of Life, I've been revisiting (yet again) ways to visualise very big phylogenies (see Very large phylogeny viewer for my last attempt).

My latest experiment uses Google Maps to render a large tree. Googletree Google Maps uses "tiles" to create a zoomable interface, so we need to create tiles for different zoom levels for the phylogeny. To create this visualisation I did the following:

  1. The phylogeny laid out in a 256 x 256 grid.
  2. The position of each line in the drawing is stored in a MySQL database as a spatial element (in this case a LINESTRING)
  3. When the Google Maps interface needs to display a tile at a certain zoom level and location, a spatial SQL query retrieves the lines that intersect the bounds of the tile, then draws those using SVG.
Hence, the tiles are drawn on the fly, rather than stored as images on disk. This is a crude proof of concept so far, there are a few issues to tackle to make this usable:
  1. At the moment there are no labels. I would need a way to compute what tables to show at what zoom level ("level of detail"). In other words, at low levels of zoom we want just a few higher taxa to be picked out, whereas as we zoom in we want more and more taxa to be labelled, until at the highest zoom levels we have the tips individually labelled.
  2. Ideally each tile would require roughly the same amount of effort to draw. However, at the moment the code is very crude and simply draws every line that intersects a tile. For example, for zoom level 0 the entire tree fits on a single tile, so I draw the entire tree. This is not going to scale to very large trees, so I need to be able to "cull" a lot of the lines and draw only those that will be visible.
In the past I've steered away from Google Maps-style interfaces because the image is zoomed along both the x and y axes, which is not necessarily ideal. But the tradeoff is that I don't have to do any work handling user interactions, I just need to focus on efficiently rendering the image tiles.

All very crude, but I think this approach has potential, especially if the "level of detail" issue can be tackled.

Friday, September 18, 2015

Towards an interactive web-based phylogeny editor (à la MacClade)

Currently in classes where I teach the basics of tree building, we still fire up ancient iMacs, load up MacClade, and let the students have a play. Typically we give them the same data set and have a class competition to see which group can get the shortest tree by manually rearranging the branches. It’s fun, but the computers are old, and what’s nostalgic for me seems alien to the iPhone generation.

One thing I’ve always wanted to have is a simple MacClade-like tree editor for the Web, where the aim is not so much character analysis as teaching the basics of tree building. Something with the easy of use as Phylo (basically Candy Crush for sequence alignments).

Slide

The challenge is to keep things as simple as possible. One idea is to have a column of taxa and you can drag individual taxa up and down to rearrange the tree.

Interactive tree design notes

Imagine each row has the characters and their states. Unlike the Phylo game, where the goal is to slide the amino acids until you get a good aliognment, here we want to move the taxa to improve the tree (e.g., based on its parsimony score).

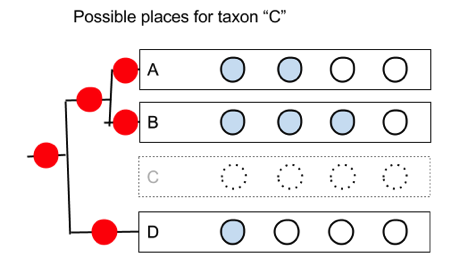
The problem is that we need to be able to generate all possible rearrangements for a given number of taxa. In the example above, if we move taxon C, there are five possible positions it could go on the remaining subtree:

2 But if we simply shuffle the order of the taxa we can’t generate all the trees. However, if we remember that we also have the internal nodes, then there is a simple way we can generate the trees. 1 When we draw a tree each row corresponds to a node. The gap between each pair of leaves (the taxa A,B,D) corresponds to the an internal nodes. So we could divide the drawing up into “hit zone”, so that if you drag the taxon we’re adding (“C”) onto the zone centred on a leaf, we add the taxon below that leaf; if we drag it onto a zone between two leaves, we attach it below that the corresponding internal node. From the user’s point of view they are still simply sliding taxa up and down, but in doing so we can create each of the possible trees.

We could implement this in a Web browser with some Javascript to handle the user moving the taxa, and draw the corresponding phylogeny to the left, and quickly update the (say, parsimony) score of the tree so that the user gets immediate feedback as to whether the rearrangement they’ve made improves the tree.

I think this could be a fun teaching tool, and if it supported touch then students could use their phones and tablets to get a sense of how tree building works.

Tuesday, May 06, 2014

Very large phylogeny viewer

As announced on phylobabble I've started to revisit visualising large phylogenies, building on some work I did a couple of years ago (my how time flies). This time, there is actual code (see https://github.com/rdmpage/deep-tree) as well as a live demo http://iphylo.org/~rpage/deep-tree/demo/.

You can see the amphibian tree below at http://iphylo.org/~rpage/deep-tree/demo/show.php?id=5369171e32b7a:

Tree

You can upload or paste a tree (for now in NEXUS format), or paste in a URL to a NEXUS file (e.g., from TreeBASE). I'll formats when I get the chance. The viewer uses the same approach as Google Maps, breaking the image of the tree into "tiles" of a fixed size, so even if the tree image is huge, the web browser only ever displays the same number of tiles. You can zoom in to see individual taxa, or zoom out for an overview. One reason I'm building this is to display DNA barcoding trees alongside the million DNA barcode map.

As ever this is a crude first attempt, but feel free to try it and let me know how you get on.

Thursday, September 05, 2013

"Lost Branches on the Tree of Life" - why must the answer be enforcing behaviour?

Bryan Drew and colleagues have published a piece in PLoS Biology bemoaning the lack of databased phylogenies:

Drew, B. T., Gazis, R., Cabezas, P., Swithers, K. S., Deng, J., Rodriguez, R., Katz, L. A., et al. (2013). Lost Branches on the Tree of Life. PLoS Biology, 11(9), e1001636. doi:10.1371/journal.pbio.1001636 (see also blog post Dude, Where’s My Data?)

This is an old problem (see for example "Towards a Taxonomically Intelligent Phylogenetic Database" doi:10.1038/npre.2007.1028.1), but alas the solution proposed by Drew et al. is also old:

Optimally, all peer-reviewed journals that publish phylogenetic datasets should require deposition (and activation for public access) of alignments and trees prior to publication, and these trees and alignments will include the same characters and taxa (and taxon names) as in the published study.

In my opinion, as soon as you start demanding people do something you've lost the argument, and you're relying on power ("you don't get to publish with us unless you do 'x'"). This is also lazy. In a talk I gave to the NSF AVATOL meeting I argued that this is the wrong approach, when building shared resources carrots are better than sticks.


In that talk I used the example of Mendeley where they build an incredibly valuable resource (a bibliography of academic research in the cloud that they sold for $US 100M) by providing a service that meet people's needs ("where's that damn PDF again?"). No brow beating, no "you must do this", just clever social engineering.

So, my challenge to the phylogenetics community (and the authors of "Lost Branches on the Tree of Life" in particular) is to stop resorting to bullying people, and ask instead how you could make it a no brainer for people to share their trees. In other words, build something people actually need and will be inspired to contribute to.

Thursday, June 13, 2013

BioNames - colourful phylogenies and downloadable SVG

My latest tweak to BioNames is to add colour to the phylogenies. Terminal nodes with the same name are labelled with the same background colour. For example, here is a tree for fiddler and ghost crabs:
Colour
The colours make it easier to see that this tree has a mixture of a few sequences from divergent taxa, and a lot of sequences from the same taxa.

Note that you can now also download the SVG drawing of the tree. Click on the Download button and (in at least some browsers, such as Chrome) the SVG will download. Other browsers may open the SVG in a separate window, in which case simply save it to your computer.

Saturday, June 08, 2013

BioNames phylogenies screencast

I've created a short screencast showing some of the phylogenies in BioNames. If you want to see these for yourself here are the links:

Friday, June 07, 2013

BioNames - Phylogenies? Yes, phylogenies

One of the things that didn't make last week's deadline for launching BioNames was the inclusion of phylogenies. This was disappointing as one of the reasons I built BioNames was to help span what I see as the gulf between classical biodiversity informatics and its emphasis on taxonomic names and classification, and modern phylogenetics where the tree is the primary focus, not some arbitrary way to partition it up.

So, where to get lots of phylogenies? I use the wonderful PhyLoTA database built by Mike Sanderson and colleagues:
Sanderson, M., Boss, D., Chen, D., Cranston, K., & Wehe, A. (2008). The PhyLoTA Browser: Processing GenBank for Molecular Phylogenetics Research. Systematic Biology, 57(3), 335-346. doi:10.1080/10635150802158688

I grabbed a dump of the trees, matched them to sequences in GenBank (more accurately, the European version, EMBL), did some post processing of those sequences, through them into CouchDB, built a SVG viewer, and voilà.

Here is a tree for the fig wasp family Agaonidae, showing the interactive zoomable tree viewer, and thumbnails for other trees for this taxon:

Moretrees

Here is a phylogeny for a genus of deep-sea mussels (Bathymodiolus), showing a map based on those sequences that are georeferenced in GenBank:

Mussels

Lastly here is the page for the
bat family Vespertilionidae in the NCBI classification. Click on the "Data" tab to see this view.

Bats

There's still lots to do on this, but the key parts are in place. Personally I can happily while away the day just browsing through the trees, looking for case where taxa lack scientific names, obvious cases of synonymy (take a look at this tree for fiddler and ghost crabs, for example), and evidence that "species" have considerable internal phylogenetic structure.

Friday, December 07, 2012

Elsevier articles have interactive phylogenies

Elsevier treeSay what you will about Elsevier, they are certainly exploring ways to re-imagine the scientific article. In a comment on an earlier post Fabian Schreiber pointed out that Elsevier have released an app to display phylogenies in articles they publish. The app is based on jsPhyloSVGand is described here. You can see live examples in these articles:

Matos-Maraví, P. F., Peña, C., Willmott, K. R., Freitas, A. V. L., & Wahlberg, N. (2013). Systematics and evolutionary history of butterflies in the “Taygetis clade” (Nymphalidae: Satyrinae: Euptychiina): Towards a better understanding of Neotropical biogeography. Molecular Phylogenetics and Evolution, 66(1), 54–68. doi:10.1016/j.ympev.2012.09.005
Poćwierz-Kotus, A., Burzyński, A., & Wenne, R. (2010). Identification of a Tc1-like transposon integration site in the genome of the flounder (Platichthys flesus): A novel use of an inverse PCR method. Marine Genomics, 3(1), 45–50. doi:10.1016/j.margen.2010.03.001
Sampleimg2Sampleimg3

Friday, October 19, 2012

The failure of phylogeny databases


It is well known that phylogeny databases such as TreeBASE capture a small fraction of the published phylogenies. This raises the question of how to increase the number of trees that get archived. One approach is compulsion:


In other words:
  1. Databasing trees is the Right Thing™ to do
  2. Few people are doing the Right Thing™
  3. This is because those people are bad/misguided and must be made to see the light

I want to suggest an alternative explanation:
  1. It is not at all obvious that databasing trees is useful
  2. The databases we have suck
  3. There's no obvious incentive for the people producing trees to database them
Why do we need a database of trees?

That we don't have a decent, widely used database of trees suggests that the argument still has to be made. Way back in the mid 1990's when TreeBASE was first starting I was at Oxford University and Paul Harvey (coauthor of The Comparative Method in Evolutionary Biology) was sceptical of its merits. Given that the comparative method depends on phylogenies, and people like Andy Purvis were in the Harvey lab building supertrees (http://dx.doi.org/10.1098/rstb.1995.0078) this may seem odd (it certainly did to me) but Paul shared the view of many systematists. Phylogenies are labile, they change with increased data and taxon sampling, hence individual trees have a short life span.

Data, in contrast, is long-lived. You'd happily reuse GenBank sequences published a decade ago, you probably wouldn't use a decade-old phylogeny. I made this point in an earlier post about the data archive Dryad (Data matters but do data sets?). A problem facing packages of data (such as papers, data sets, and phylogenies) is that the package itself may be of limited interest, beyond reproducing earlier results and benchmarking. In the case of phylogenies, if someone has a tree ((a,b),c) and someone else has a tree ((d,e),f), it's not obvious that we can combine these. But if we have sequences for the same gene from the same six taxa we can build a larger tree, say (((a,d),(b,e)),(c,f)).

I think this is part of the reason why GenBank works. Yes, there is compulsion (it's very hard to publish on sequences if you haven't deposited the data in GenBank), but there are clear benefits of depositing data. As the database grows we can do bigger analyses. If you are trying to identify a species based on its DNA, the chances are that the nearest sequence will have been deposited by somebody else. By depositing data your work it also lasts longer than if people just had the paper (your tree is likely to be outdated, that sequence from a rare, hard to obtain species might be used for decades to come).

Note that I'm not saying a database of trees isn't a good idea, but there seems to be an assumption that it is so obvious that it doesn't need justification. Demonstrably this isn't the case. Maybe we should figure out what we'd want to do with such a database, then tackle how we'd make that possible. For example, I'd want to query a phylogeny database geographically (show me trees from this part of the globe), by ecological association (find the trees for any parasites on this clade), by temporal period (what clades originated in the Miocene?), by data (what trees used this sequence which we now know is chimeric?), by topology (have we settled on the sister group to snakes yet?), and so on. I would also argue that much of this is doable, but might not actually require archiving published phylogenies. Personally I think anybody tackling these questions would do well to use PhyLoTA as their starting point.

TreeBASE sucks

Yes, I'm as sick of saying this as you are of reading it. But it doesn't change the fact that just about everything about TreeBASE from the complexity of the underlying data model, the choice of programming language, the use of a Java applet to display trees, the Byzantine search interface, and the voluminous XML output make TreeBASE a bag of hurt. None of this would matter much if it was an indispensable part of people's research toolkit, but this isn't the case. If you are trying to convince people of the benefits of sharing trees you really want a tool that makes a it seem a no brainer. We aren't there yet.

The "fuck this" point

In a great post on the piracy threshold, Matt Gemmell argues that piracy is largely the fault of content providers because they make being honest too difficult. How many times have you wanted to buy something such as a book or a movie only to discover that the content provider doesn't sell it in your part of the world (e.g., in the iBooks store in the US but not the UK) or doesn't provide it in the media you want (e.g., DVD but not online)? To top it off every time you go to the movies you are subjected to emotional blackmail or threats of unlimited fines if you were to copy the movie you already paid to watch?

6892585935 32d4e21e77 o

I think databases have the same "fuck this" threshold. If you are asking people to submit data you want to make it as easy as possible. And you want at least some of the benefits to be immediate and obvious. Otherwise you are left with coercing people, and that's being, at best, lazy.

If you want an example of how to do it right, look at Mendeley's model. They want to build a public cloud of academic papers, a laudable goal, the Right Thing™ to do. But they sell the idea not as a public good, not as the Right Thing™, nor by trying to compel people (they can't, they're a private company). Instead they address a major point of pain - where the hell did I put that PDF? - and make it trivial to organise your collection of articles. Then they make it possible to back them up to the cloud, to view them on multiple devices, to share them, and viola, we get a huge database of publications. The sociology works. So, my question is, what would the equivalent be for phylogenetics?

Monday, January 30, 2012

BLAST a sequence and get a tree

For this weeks sessions of my phyloinformatics course I'm developing some phylogeny tools. The first is a simple AJAX-based BLAST tool. I've always wanted a quick way to see a GenBank sequence in its phylogenetic context, so I've built a simple tool to that takes a GenBank accession number or GI number, submits a BLAST job, retrieves the sequences, aligns them using CLUSTALW, builds a quick and dirty neighbour-joining tree using PAUP*, then displays the tree using SVG (if your browser doesn't support this you won't see the tree). One use for this is to quikcly get a sense of whether an unnamed ("dark") taxon is related to sequences that have been identified.

Nothing fancy, but it was a chance to display the whole process in the browser without opening new windows or refreshing the page. Here's an example for the GenBank sequence FJ559186:


For the technically-minded, the calls to BLAST and the alignment and tree construction tools all use AJAX, and there's a simple Javascript timer to countdown the seconds that the NCBI BLAST web service estimates the BLAST job will take, before we poll NCBI to see if the job has in fact finished. The code is in GitHub.

Tuesday, July 12, 2011

Talk @vizbi on phylogeny visualisation

The talks from the 2001 workshop on Visualizing Biological Data (VizBi 2011) are now available on Vimeo. There were some great talks at VizBi, especially the keynotes (the "featured videos" on the Vimeo page for VizBi).

My own (slightly breathless) talk was on phylogeny visualisation, which you can watch below.

Visualization of phylogenetics & phylogeography from Roderic Page on Vimeo.


In the talk I mention that the slides are also on SlideShare, and that is where you'll find URLs for the projects I mention. The URls aren't all that easy to get that way, so here they are:

Thursday, February 24, 2011

Why 3D phylogeny viewers don't work

Matt Yoder (@mjyoder had a Twitter conversation yesterday about phylogeny viewers, prompted by my tweeting about my latest displacement activity, a 2D tree browser using the tiling approach made popular by Google Maps.

As part of that conversation, Matt tweeted:
RT @rdmpage: @mjyoder - I think 3D is the worse thing we could do, there's no natural mapping to 3D. <- meh, where's the imagination?

Well, Matt's imagination has gone into overdrive, and he's blogged about his ideas.

3d_tree_browsing.jpg


This issue deserves more exploration, but here are some quick thoughts. 3D has been used in a number of phylogeny browsers, such as Mike Sanderson's Paloverde, Walrus, and the Wellcome Trust's Tree of Life. I don't find any terribly successful, pretty as they may be. I think there are several problems with trees in general, and 3D versions in particular.

Trees aren't real
Trees aren't real in the same way that the physical world is (or even imagined physical worlds). Trees are conceptual structures. The history of web interfaces is littered with attempts to visualise conceptual space, for example to summarise search results. These have been failures, a simple top ten list as used by Google wins. I don't think this is because Google's designers lack imagination, it's because it works. Furthermore, this is actually a very successful visualisation:


I think elaborate attempts to depict conceptual spaces on screens are mostly going to fail.

Trees are empty
Compared to, say, a geographic map, trees are largely empty space. In a map every pixel counts, in that it potentially represents something. Think of the satellite view in Google Maps. Each pixel on the screen has information. Trees are largely empty, hence much of the display space is wasted. Moving trees to 3D just gives us more space to waste.

Trees don't have a natural ordering
Even if we accept that trees are useful visualisations, they have problems. Given the tree ((1,2),(3,4)); we have a lot of (perhaps too much) freedom in how we can depict that tree. For example, both diagrams below depict this tree. In the x-axis there is a partial order of internal nodes (the ancestor of {1,2} must be to the right of the ancestor {1,2,3,4}), but the tree ((1,2),(3,4)); says nothing about the relative ordering of {1,2} versus {3,4}. We are free to choose. A natural linear ordering would be divergence time, but estimates of those times can be contested, or unavailable.

order.png


Phylogenies are unordered trees in the sense that I can rotate any node about it's ancestor and still have the same tree (compare the two trees above). Phylogenies are like mobiles:


The practical consequence of this is that different tree viewers can render the same tree in very different ways, making navigation across viewers unpredictable. Compare this to maps. Even if I use different projections, the maps remain recognisably similar, and most maps retain similar relationships between areas. If I look at a map of Glasgow and move left I will end up in the Atlantic Ocean, no matter if I use Google Maps or Microsoft Maps. Furthermore, trees grow in a way that maps don't (at least, not much). If I add nodes to a tree it may radically change shape, destroying navigation cues that I may have relied on before. Typically maps change by the addition of layers, not by moving bits around (paleogeographic maps excepted).

Trees aren't 3D
There's nothing intrinsically 3D about trees, which means any mapping to 3D space is going to be arbitrary. Indeed, most 3D viewers simply avoid any mapping and show a 2D tree in 3D space, which seems rather pointless.

Perhaps it's because I don't play computer games much (went through an Angry Birds phase, and occasionally pick up an X-Box controller, only to be mercilessly slaughtered by my son), but I'm not inspired by the analogy with computer games. I'm not denying that there are useful things to learn from games (I'm sure the controls in Google Earth owe something to games). But games also rely on a visceral connection with the play, and an understanding of the visual vocabulary (how to unlock treasure, etc.). Matt's 3D model requires users to learn a whole visual vocabulary, much of which (e.g., "Fruit on your tree? Someone has left comment(s) or feedback. ") seems forced.

My sense is that the most successful interfaces make the minimal demands on users, don't fight their intuition, and don't force them to accept a particular visualisation of their own cognitive space.

I'll write more about this once I get my 2D tree viewer into shape where it can be shown. It will be a lot less imaginative than Matt's vision, all I'm shooting for is that it is usable.


Wednesday, December 15, 2010

TreeBASE, again

My views on TreeBASE are pretty well known. Lately I've been thinking a lot about how to "fix" TreeBASE, or indeed, move beyond it. I've made a couple of baby steps in this direction.

The first step is that I've created a group for TreeBASE papers on Mendeley. I've uploaded all the studies in TreeBASE as of December 13 (2010). Having these in Mendeley makes it easier to tidy up the bibliographic metadata, add missing identifiers (such as DOIs and PubMed ids), and correct citations to non-existent papers (which can occur if at the time the authors uploaded their data the planned to submit their paper to one journal, but it ending up being accepted in another). If you've a Mendeley account, feel free to join the group. If you've contributed to TreeBASE, you should find your papers already there.

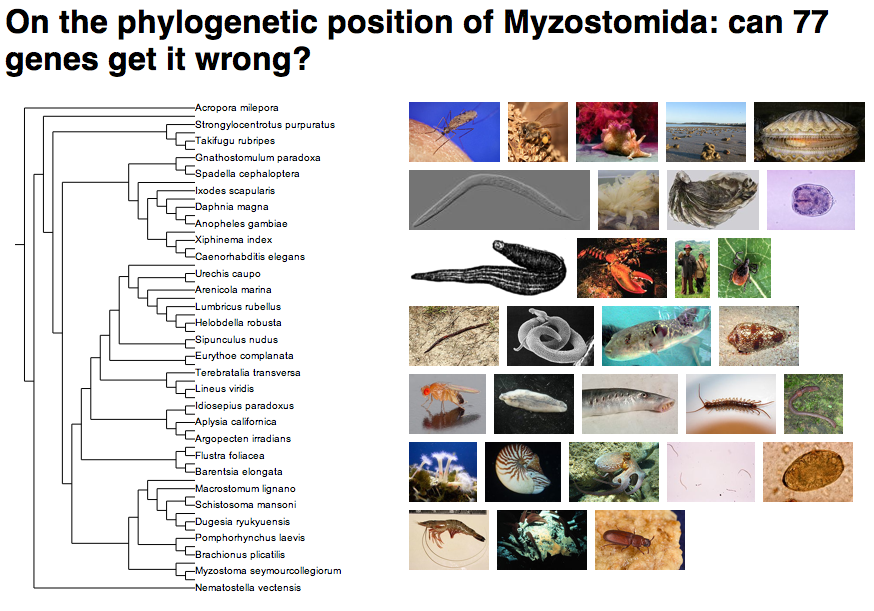
The second step is playing with CouchDB (this years new hotness), exploring ways to build a database of phylogenies that has nothing much to do with either a relational database or a triple store. CouchDB is a document store, and I'm playing with taking NeXML files from TreeBASE, converting them to something vaguely usable (i.e., JSON), and adding them to CouchDB. For fun, I'm using my NCBI to Wikipedia mapping to get images for taxa, so if TreeBASE has mapped a taxon to the NCBI taxonomy, and that taxon has a page in Wikipedia with an image, we get an image for that taxon. The reason for this is I'd really like a phylogeny database that was visually interesting. To give you some examples, here are trees from TreeBASE (displayed using SVG), together with thumbnails of images from Wikipedia:

myzo.png


troidini.png


protea.png


Snapshot 2010-12-15 10-38-02.png


Everything (tree and images) is stored within a single document in CouchDB, making the display pretty trivial to construct. Obviously this isn't a proper interface, and there's things I'd need to do, such as order the images in such a way that they matched the placement of the taxa on the tree, but at a glance you can see what the tree is about. We could then envisage making the images clickable so you could find out more about that taxon (e.g., text from Wikipedia, lists of other trees in the database, etc.).

We could expand this further by extracting geographical information (say, from the sequences included in the study) and make a map, or eventually a phylogeny on Google Earth) (see David Kidd's recent "Geophylogenies and the Map of Life" for a manifesto doi:10.1093/sysbio/syq043).

One of the big things missing from databases like TreeBASE is a sense of "fun", or serendipity. It's hard to find stuff, hard to discover new things, make new connections, or put things in context. And that's tragic. Try a Google image search for treebase+phylogeny:

treebasephylogeny.png

Call me crazy, but I looked at that and thought "Wow! This phylogeny stuff is cool!" Wouldn't it be great if that's the reaction people had when they looked at a database of evolutionary trees?

Wednesday, May 12, 2010

Drawing a phylogeny in a web browser using the canvas element

Some serious displacement activity. I'm toying with adding phylogenies to iSpecies, probably sourced from the PhyLoTA browser. This raises the issue of how to display trees on a web page. PhyLoTA itself uses bitmap images, such as this one:
ti26779_cl0-201004120822386532.png
but I'd like to avoid bitmaps. I toyed with using SVG, but that has it's own series of issues (it basically has to be served as a separate file). So, I've spent a couple of hours playing with the <canvas> element. This enables some quite nice drawing to be down in a browser window, without plugins, SVG, or Flash. I wrote a quick PHP script to parse a Newick tree and draw it using <canvas>. It's really pretty simple, and the results are quite nice:
canvas.png
One minor gotcha is interacting with the diagram (this is one advantage of SVG). Turns out we need a hack, so I've used the trick of a blank, transparent GIF and a usemap (see Greg Houston's Canvas Pie Chart with Tooltips). The picture above is a screen shot, you can see a live example here.

Thursday, April 22, 2010

What I want from a web phylogeny viewer - XML, SVG and Newick round tripping

Random half-formed idea time. Thinking about marking up an article (e.g., from PLoS) with a phylogeny (such as the image below, see doi:10.1371/journal.pone.0001109.g001), I keep hitting the fact that existing web-based tree viewers are, in general, crap.
53BC7C85-7D00-475D-AE8A-7D91FBE75068.jpg

Given that a PLoS article is an XML document, it would be great if the tree diagram was itself XML, in particular SVG. But, in one sense, we don't want just a diagram, we want access to the underlying tree (for example, so we can play with it in other software). The tree may or may not be available in TreeBASE, but what if the diagram itself was the tree? In other words, imagine a tree viewing program could output SVG, structured in such a way that with a XSLT stylesheet the underlying tree could be extracted (say in Newick or, gack, NexXML) from the SVG, but users could take the SVG and embellish it (in Adobe Illustrator or Inkscape). The nice illustration and the tree data structure would be one and the same thing! No getting tree and illustration out of sync, and no hoping authors have put tree in a database somewhere -- the article contains the tree.

In order for this to happen, we need a tree viewer that exports SVG, and ideally would allow annotation so that the author could do most of the work within that program (ensuring that the underlying tree object isn't broken by graphic editing). Then export the SVG, add extract bits in Illustrator/Inkscape if needed, and have it incorporated into the article XML (which is what the publisher uses to render the article on the web). Simples.

Thursday, October 01, 2009

Co-located Collaborative Tree Comparison

Stumbled across this cool visualisation project by Petra Isenberg at Calgary University. Collaborative tree comparison uses a tabletop system to enable two (or more) people to interact when comparing (in this case) phylogenies. I want one!

The system is described in "Interactive Tree Comparison for Co-located Collaborative Information Visualization" (doi:10.1109/TVCG.2007.70568), a PDF of which is available from her web site (which also has a great video entitled "how co-located collaborative data analysis should not take place").


Wednesday, May 27, 2009

Visualizing the Evolutionary Tree of Life

Over on the EOL blog is a summary of a meeting Visualizing the Evolutionary Tree of Life. This sounds like it was a fun meeting, but part of me is suffering from déjà vu. Our community has tossed this subject around for a while now. I recall Tamara Munzner wowing us with the H3 hyperbolic browser at a meeting at UC Davis in 2000 (part of the original NSF TOL workshops, archived herel) -- the image of Joel Cracraft excitedly running up to the display screen to find various birds is forever etched into my brain. TreeJuxtaposer has been around for a while, to not much effect.

We seem to continue to fail to make much progress on this topic, despite meetings such as the EOL one, great reviews of the topic, fancy 3D visualisation, and Mike Sanderson's way kewl wall of monitors.

Maybe progress was made at the EOL meeting, but I don't get the sense that we're any further forward. It would be interesting to work out why we've struggled to satisfactorily solve this problem.