Showing posts with label Genbank. Show all posts

Thursday, November 15, 2018

Geocoding genomic databases using GBIF

LwyH1HFe 400x400I've put a short note up on bioRxiv about ways to geocode nucleotide sequences in databases such as GenBank. The preprint is "Geocoding genomic databases using GBIF" https://doi.org/10.1101/469650.

It briefly discusses using GBIF as a gazetteer (see https://lyrical-money.glitch.me for a demo) to geocode sequences, as well as other approaches such as specimen matching (see also Nicky Nicolson's cool work "Specimens as Research Objects: Reconciliation across Distributed Repositories to Enable Metadata Propagation" https://doi.org/10.6084/m9.figshare.7327325.v1).

Hope to revisit this topic at some point, for now this preprint is a bit of a placeholder to remind me of what needs to be done.

Friday, October 06, 2017

Notes on finding georeferenced sequences in GenBank

Notes on how many georeferenced DNA sequences there are in GenBank, and how many could potentially be georeferenced.

BCT	Bacterial sequences
PRI	Primate sequences
ROD	Rodent sequences
MAM	Other mammalian sequences
VRT	Other vertebrate sequences
INV	Invertebrate sequences
PLN	Plant and Fungal sequences
VRL	Viral sequences
PHG	Phage sequences
RNA	Structural RNA sequences
SYN	Synthetic and chimeric sequ
UNA	Unannotated sequences

https://eutils.ncbi.nlm.nih.gov/entrez/eutils/esearch.fcgi
?db=nucleotide nucleotides
&term=ddbj embl genbank with limits[filt]
NOT transcriptome[All Fields] ignore transcriptome data
NOT mRNA[filt] ignore mRNA data
NOT TSA[All Fields] ignore TSA
NOT scaffold[All Fields] ignore scaffold
AND src lat lon[prop] include records that have source feature "lat_lon"
AND 2010/01/01:2010/12/31[pdat] from this date range
AND gbdiv_pri[PROP] restrict search to PRI division (primates)
AND srcdb_genbank[PROP] Need this if we query by division, see NBK49540

Numbers of nucleotide sequences that have latitude and longitudes in GenBank for each year.

DatePRIRODMAMVRTINVPLN
2010/01/01412725529551926927174
2011/01/013711204816017657784947968
2012/01/01658034214216968406027314
2013/01/01297349761107647041123435
2014/01/011529044761145986807614018
2015/01/0117452719831784336353835501
2016/01/0158261512631489875789322813
2017/01/0193817581017107127506628180

Numbers of nucleotide sequences that don't have latitude and longitudes in GenBank for each year but do have the country field and hence could be georeferenced.

DatePRIRODMAMVRTINVPLN
2010/01/01666026545534326666257756692
2011/01/01399832666210337177401598664
2012/01/015377559072835533286945103379
2013/01/011092848058013663736971995817
2014/01/019727349267515991377816135372
2015/01/0189226774139646057885867167337
2016/01/0164303384108606223895711145111
2017/01/0111474352049124115991219109747

Wednesday, April 15, 2015

Linking specimen codes to GBIF

I've put together a working demo of some code I've been working on to discover GBIF records that correspond to museum specimen codes. The live demo is at http://bionames.org/~rpage/material-examined/ and code is on GitHub.

To use the demo, simply paste in a specimen code (e.g., "MCZ 24351") and click Find and it will do it's best to parse the code, then go off to GBIF and see what it can find. Some examples that are fun include MCZ 24351, KU:IT:00312, MNHN 2003-1054, and AMS I33708-051

Material

It's proof of concept at this stage, and the search is "live", I'm not (yet) storing any results. For now I simply want to explore how well if can find matches in GBIF.

By itself this isn't terribly exciting, but it's a key step towards some of the things I want to do. For example, the NCBI is interested in flagging sequences from type specimens (see http://dx.doi.org/10.1093/nar/gku1127 ), so we could imagine taking lists of type specimens from GBIF and trying to match those to voucher codes in GenBank. I've played a little with this, unfortunately there seem to be lots of cases where GBIF doesn’t know that a specimen is, in fact, a type.

Another thing I’m interested in is cases where GBIF has a georeferenced specimen but GenBank doesn’t (or visa versa), as a stepping stone towards creating geophylogenies. For example, in order to create a geophylogeny for Agnotecous crickets in New Caledonia (see GeoJSON and geophylogenies ) I needed to combine sequence data from NCBI with locality data from GBIF.

It’s becoming increasingly clear to me that the data supplied to GBIF is often horribly out of date compared to what is in the literature. Often all GBIF gets is what has been scribbled in a collection catalogue. By linking GBIF records to specimen codes cited that are cited in the literature we could imagine giving GBIF users enhanced information on a given occurrence (and at the same time get citation counts for specimens The impact of museum collections: one collection ≈ one Nobel Prize).

Lastly, if we can link specimens to sequences and the literature, then we can populate more of the biodiversity knowledge graph

Tuesday, April 08, 2014

The Experimenter’s Museum: GenBank, Natural History, and the Moral Economies of Biomedicine

An undergraduate student (Aime Rankin) doing a project with me on citation and impact of museum collections came across a paper I hadn't seen before:
Strasser, B. J. (2011, March). The Experimenter’s Museum: GenBank, Natural History, and the Moral Economies of Biomedicine. Isis. University of Chicago Press. doi:10.1086/658657


Unfortunately the paper is behind a paywall, but here's the abstract (you can also get a PDF here):

Today, the production of knowledge in the experimental life sciences relies crucially on the use of biological data collections, such as DNA sequence databases. These collections, in both their creation and their current use, are embedded in the experimentalist tradition. At the same time, however, they exemplify the natural historical tradition, based on collecting and comparing natural facts. This essay focuses on the issues attending the establishment in 1982 of GenBank, the largest and most frequently accessed collection of experimental knowledge in the world. The debates leading to its creation—about the collection and distribution of data, the attribution of credit and authorship, and the proprietary nature of knowledge—illuminate the different moral economies at work in the life sciences in the late twentieth century. They offer perspective on the recent rise of public access publishing and data sharing in science. More broadly, this essay challenges the big picture according to which the rise of experimentalism led to the decline of natural history in the twentieth century. It argues that both traditions have been articulated into a new way of producing knowledge that has become a key practice in science at the beginning of the twenty-first century.

It's well worth a read. It argues that sequence databases such as Genbank are essentially the equivalent of the great natural history museums of the 19th Century. There are several ironies here. One is that some early advocates of molecular biology cast it as a modern, experimental science as opposed to mere natural history. However, once the amount of molecular data became too great for individuals to easily manage, and once it became clear that many of the questions being asked required a comparative approach, the need for a centralised database of sequences (the "experimenter's museum" of the title of the paper) became increasingly urgent. Another irony is that the clash between molecular and morphological taxonomy overlooks these striking similarities in history (collecting ever increasing amounts of data eventually requiring centralisation).

Bruno Strasser's article also discusses the politics behind setting up GenBank, including the inevitable challenge of securing funding, and the concerns of many individual scientists about the loss of control over their data. A final irony is that, having gone through this process once with the formation of the big museums in the 19th century, we are going through it again with the wrangling over aggregating the digitised versions of the content of those museums.

Update: See also
Strasser, B. J. (2008, October 24). GENETICS: GenBank--Natural History in the 21st Century? Science. American Association for the Advancement of Science (AAAS). doi:10.1126/science.1163399
(via Guanyang Zhang).

Friday, January 24, 2014

NCBI taxonomy database now shows type material

26243 367877492480 367794192480 4194340 6124010 nScott Federhen told me about a nice new feature in GenBank that he's described in a piece for NCBI News. The NCBI taxonomy database now shows a its of type material (where known), and the GenBank sequence database "knows: about types. Here's the summary:

The naming, classification and identification of organisms traditionally relies on the concept of type material, which defines the representative examples ("name-bearing") of a species. For larger organisms, the type material is often a preserved specimen in a museum drawer, but the type concept also extends to type bacterial strains as cultures deposited in a culture collection. Of course, modern taxonomy also relies on molecular sequence information to define species. In many cases, sequence information is available for type specimens and strains. Accordingly, the NCBI has started to curate type material from the Taxonomy database, and are using this data to label sequences from type specimens or strains in the sequence databases. The figure below shows type material as it appears in the NCBI taxonomy entry and a sequence record for the recently described African monkey species, Cercopithecus lomamiensis.
Cercopithecus

You can query for sequences from type using the query "sequence from type"[filter]. This could lead to some nice automated tools. If you had a bunch of distinct clusters of sequences that were all labelled with the same species name, and one cluster includes a sequence form the type specimen, then the other clusters are candidates for being described as new names.

Thursday, December 12, 2013

Guest post: response to "Putting GenBank Data on the Map"

DES Tahiti 09 biggerThe following is a guest blog post by David Schindel and colleagues and is a response to the paper by Antonio Marques et al. in Sciencedoi:10.1126/science.341.6152.1341-a.

Marques, Maronna and Collins (1) rightly call on the biodiversity research community to include latitude/longitude data in database and published records of natural history specimens. However, they have overlooked an important signal that the community is moving in the right direction. The Consortium for the Barcode of Life (CBOL) developed a data standard for DNA barcoding (2) that was approved and implemented in 2005 by the International Nucleotide Sequence Database Collaboration (INSDC; GenBank, ENA and DDBJ) and revised in 2009. . All data records that meet the requirements of the data standard include the reserved keyword 'BARCODE'. The required elements include: (a) information about the voucher specimen from which the DNA barcode sequence was derived (e.g., species name, unique identifier in a specimen repository, country/ocean of origin); (b) a sequence from an approved gene region with minimum length and quality; and (c) primer sequences and the forward and reverse trace files. Participants in the workshops that developed the data standard decided to include latitude and longitude as strongly recommended elements but not as strict requirements for two reasons. First, many voucher specimens from which BARCODE records are generated may have been collected before GPS devices were available. Second, barcoding projects such as the Barcode of Wildlife Project (4) are concentrating on rare and endangered species. Publishing the GPS coordinates of collecting localities would facilitate illegal collecting and trafficking that could contribute to biodiversity loss.

The BARCODE data standard is promoting precisely the trend toward georeferencing called for by Marques, Marrona and Collins. Table 1 shows that there are currently 346,994 BARCODE records in INSDC (3). Of these BARCODE records, 83% include latitude/longitude data. Despite not being a required element in the data standard, this level of georeferencing is much higher than for all cytochrome c oxidase I gene (COI), the BARCODE region, 16S rRNA, and cytochrome b (cytb), another mitochondrial region that was used used for species identification prior to the growth of barcoding. Data are also presented on the numbers and percentages of data records that include information on the voucher specimen from which the nucleotide sequence was obtained. In an increasing number of cases, these voucher specimen identifiers in INSDC are hyperlinked to the online specimen data records in museums, herbaria and other biorepositories. Table 2 provides these same data for the time interval used in the Marques et al. letter (1). These tables indicate the clear effect that the BARCODE data standard is having on the community’s willingness to provide more complete data documentation.

Table 1. Summary of metadata for GPS coordinates and voucher specimens associated with all data records.
Categories of data recordsTotal number of GenBank recordsWith Latitude/LongitudeWith Voucher or Culture Collection Specimen IDs
BARCODE347,349286,975 (83%)347,077 (~100%)
All COI751,955365,949 (49%)531,428 (71%)
All 16S4,876,284461,030 (9%)138,921 (3%)
All cytb239,7967,776 (3%)84,784 (35%)

Table 2.
Summary of metadata for GPS coordinates and voucher specimens associated with data records submitted between 1 July 2011 and 15 June 2013.
Total number of GenBank recordsWith Latitude/LongitudeWith Voucher or Culture Collection Specimen IDs
BARCODE160,615132,192 (82%)160,615 (100%)
All COI302,507166,967 (55%)231,462 (77%)
All 16S1,535,364232,567 (15%)49,150 (3%)
All cytb74,6312,920 (4%)24,386 (33%)


The DNA barcoding community's data standard is demonstrating two positive trends: better documentation of specimens in natural history collections, and new connectivity between databases of species occurrences and DNA sequences. We believe that these trends will become standard practices in the coming years as more researchers, funders, publishers and reviewers acknowledge the value of, and begin to enforce compliance with the BARCODE data standard and related minimum information standards for marker genes (5).

DAVID E. SCHINDEL1, MICHAEL TRIZNA1, SCOTT E. MILLER1, ROBERT HANNER2, PAUL D. N. HEBERT2, SCOTT FEDERHEN3, ILENE MIZRACHI3
  1. National Museum of Natural History, Smithsonian Institution Smithsonian Institution, Washington, DC 20013–7012, USA.
  2. University of Guelph, Ontario, Canada
  3. National Center for Biotechnology Information, National Library of Medicine, National Institutes of Health, Bethesda, MD, USA

References

  1. Marques, A. C., Maronna, M. M., & Collins, A. G. (2013). Putting GenBank Data on the Map. Science, 341(6152), 1341–1341. doi:10.1126/science.341.6152.1341-a
  2. Consortium for the Barcode of Life, http://www.barcodeoflife.org/sites/default/files/DWG_data_standards-Final.pdf (2009)
  3. Data in Tables 1 and 2 were drawn from GenBank (http://www.ncbi.nlm.nih.gov/genbank/) [data as of 1 October 2013]
  4. Barcode of Wildlife Project, http://www.barcodeofwildlife.org (2013)
  5. Yilmaz, P., Kottmann, R., Field, D., Knight, R., Cole, J. R., Amaral-Zettler, L., Gilbert, J. A., et al. (2011). Minimum information about a marker gene sequence (MIMARKS) and minimum information about any (x) sequence (MIxS) specifications. Nature Biotechnology, 29(5), 415–420. doi:10.1038/nbt.1823

Thursday, March 01, 2012

Yet more reasons to have specimen identifiers: annotating GenBank sequences

One reason I'm pursuing the theme of specimen identifiers (and identifiers in general) is the central role they play in annotating databases. To give a concrete example, I (among others) have argued for a wiki-style annotation layer on top of GenBank to capture things such as sequencing errors, updated species names, etc. Annotation is a lot easier if we have consistent identifiers for the things being annotated. For example, every GenBank sequence has a unique accession number, so if you and I are discussing sequence DQ055738, you and I can be sure we are talking about the same thing.

Sequence DQ055738 is interesting because Hua et al. A Revised Phylogeny of Holarctic Treefrogs (Genus Hyla) Based on Nuclear and Mitochondrial DNA Sequences (http://dx.doi.org/10.1655/08-058R1.1 - note the nice identifier we have for this article) have suggested this sequence (published in http://dx.doi.org/10.1554/05-284.1, another nice identifier) is misidentified. Given these identifiers we could construct various statements, such as:


DQ055738 -> published in -> doi:10.1554/05-284.1
DQ055738 -> annotated by -> doi:10.1655/08-058R1.1

(I've omitted the http:// stuff to keep things legible). Hua et al: state the following:

However, the tissue number of this specimen (LSUMZ H-19067) is similar to that of a specimen of H. versicolor (LSUMZ H-19077), which appears to have been processed at the same time (C. Austin, personal communication). Therefore, we hypothesize that the sequence data for H. gratiosa used by Smith et al. (2005) were actually from H. versicolor.

It would be nice if we had unique, resolvable identifiers for LSUMZ H-19067 and LSUMZ H-19077 so that we could construct statements linking the sequence, the publications, and the specimens. But we don't. Nor is it obvious how to find out anything more about LSUMZ H-19067 and LSUMZ H-19077. By contrast, for the DOI or the sequence accession I know how to get more information, in either human- or machine-readable form.

The acronym LSUMZ in this case is the Lousiana State University Museum of Natural Science Herpetology collection (http://biocol.org/urn:lsid:biocol.org:col:34806). Just to confuse matters, LSUMZ specimens in GBIF use LSU as the acronym for Lousiana State University Museum of Natural Science. Given that GBIF's data comes from LSU itself, it's odd (but not surprising) that there's a muddle about which acronym to use (it would be nice to clear this up, but then anybody building identifiers based on those acronyms is in for some heartbreak).

If I look at GBIF LSUMZ records there aren't specimens with the catalogue numbers H-19067 or H-19077. However, after a bit of poking around, and a helpful file from GBIF's Tim Robertson, I discovered that the LSUMZ herpetology tissue numbers (which is what the H-* codes actually are) are stored in GBIF, so I've found the corresponding specimens are http://data.gbif.org/occurrences/45716232 (LSU Herp 84850, LSUMZ HerpNet Tissue 19067) and http://data.gbif.org/occurrences/45710033 (LSU Herp 84862, LSUMZ HerpNet Tissue 19077). (Note that Hua et al. tell the reader that LSU 84850 = LSUMZ H-19067, but don't give the specimen code for LSUMZ H-19077).

Now I have some resolvable identifiers, so I could construct statements like:


DQ055738 -> voucher -> occurrences/45716232
DQ055738 -> voucher -> occurrences/45710033
|
+-> according to -> doi:10.1655/08-058R1.1

Let's skip over whether this is actually the best way to record the annotation, the point is we can now start to construct statements that can be linked to the wider world. If someone else has made statements about these specimens, and they used the GBIF URL, then we could aggregate those and learn more about these specimen and their associated sequences. Without globally unique, stable, resolvable identifiers we are left to flounder around in the bowels of various databases searching for something that may or may not be the object being discussed. Isn't it time we did something about this?

Tuesday, February 21, 2012

Linking GBIF and Genbank

As part of my mantra that it's not about the data, it's all about the links between the data, I've started exploring matching GenBank sequences to GBIF occurrences using the specimen_voucher codes recorded in GenBank sequences. It's quickly becoming apparent that this is not going to be easy. Specimen codes are not unique, are written in all sorts of ways, there are multiple codes for the same specimen (GenBank sequences may be associated with museum catalogue entries, or which field or collector numbers).

So why undertake what is fast looking like a hopeless task? There are several reasons:
  1. GBIF occurrences have a unique URL which we could potentially use as a unique, resolvable identifier for the corresponding specimen.
  2. Linking GenBank to GBIF would make it possible for GBIF to list sequences associated with a specimen, as well as the associated publication, which means we could demonstrate the "impact" of a specimen. In the simplest terms this could be the number of sequences and publications that use data from the specimen, more sophisticated approaches could use PageRank-like measures, see hdl:10101/npre.2008.1760.1.
  3. Having a unique identifier that is shared across different databases makes it easier to combine data from different sources. For example, if a sequence in GenBank lacks geographic coordinates but the voucher specimen in GBIF is georeferenced, we can use that information to locate the sequence in geographic space (and hence build geophylogenies or add spatial indexes to databases such as TreeBASE). Conversely, if the GenBank sequence is georeferenced but the GBIF record isn't we can update the GBIF record and possibly expand the range of the corresponding taxon (this was part of the motivation behind hdl:10101/npre.2009.3173.1.

As an example, below is the GBIF 1° density map for the frog Pristimantis ridens from GBIF, with the phylogeny from Wang et al.Phylogeography of the Pygmy Rain Frog (Pristimantis ridens) across the lowland wet forests of isthmian Central Americahttp://dx.doi.org/10.1016/j.ympev.2008.02.021 layered over it. I created the KML tree from the corresponding tree in TreeBASE using the tool I described earlier. You can grab the KML for the tree here.

Density

As we'd expect, there is a lot of overlap in the two sources of data. If we investigate further, there are records that are in fact based on the same specimen. For example, if we download the GBIF KML file with individual placemarks we see that in the northern part of the range their are 15 GBIF occurrences that map onto the same point as one of the terminal taxa in the tree.

Gbif

One of these 15 GBIF records (http://data.gbif.org/occurrences/244335848) is for specimen USNM 514547, which is the voucher specimen for EU443175. This gives us a link between the record in GBIF and the record in GenBank. It also gives us a URI we can use for the specimen http://data.gbif.org/occurrences/244335848 instead of the unresolvable and potentially ambiguous USNM 514547.

If we view the geophylogeny from a different vantage point we see numerous localities that don't have occurrences in GBIF.

Nogbif

Close inspection reveals that some of the specimens listed in the Wang et al. paper are actually in GBIF, but lack geographic coordinates. For example the OTU "Pristimantis ridens Nusagandi AJC 0211" has the voucher specimen FMNH 257697. This specimen is in GBIF as http://data.gbif.org/occurrences/57919777/, but without coordinates, so it doesn't appear on the GBIF map. However, both the Wang et al. paper and the GenBank record for the sequence from this specimen EU443164 give the latitude and longitude. In this example, GBIF gives us a unique identifier for the specimen, and GenBank provides data on location that GBIF lacks.

Part of GBIFs success is due to the relative ease of integrating data by taxonomic names (despite the problems caused by synonyms, homonyms, misspellings, etc.) or using spatial coordinates (which immediately enables integration with environmental data. But if we want to integrate at deeper levels then specimen records are the glue that connects GBIF (and its contributing data sources) to sequence databases, phylogenies, and the taxonomic literature (via lists of material exampled). This will not be easy, certainly for legacy data that cites ambiguous specimen codes, but I would argue that the potential rewards are great.

Wednesday, October 19, 2011

TDWG Challenge - what is RDF good for?

Last month, feeling particularly grumpy, I fired off an email to the TDWG-TAG mailing list with the subject Lobbing grenades: a challenge. Here's the email:
It's morning and the coffee hasn't quite kicked in yet, but reading through recent TDWG TAG posts, and mindful of the upcoming meeting in New Orleans (which sadly I won't be attending) I'm seeing a mismatch between the amount of effort being expended on discussions of vocabularies, ontologies, etc. and the concrete results we can point to.

Hence, a challenge:

"What new things have we learnt about biodiversity by converting biodiversity data into RDF?"

I'm not saying we can't learn new things, I'm simply asking what have we learnt so far?

Since around 2006 we have had literally millions of triples in the wild (uBio, ION, Index Fungorum, IPNI, Catalogue of Life, more recently Biodiversity Collections Index, Atlas of Living Australia, World Register of Marine Species, etc.), most of these using the same vocabulary. What new inferences have we made?

Let's make the challenge more concrete. Load all these data sources into a triple store (subchallenge - is this actually possible?). Perhaps add other RDF sources (DBpedia, Bio2RDF, CrossRef). What novel inferences can we make?

I may, of course, simply be in "grumpy old arse" mode, but we have millions of triples in the wild and nothing to show for it. I hope I'm not alone in wondering why...

In the context of the TDWG meeting (happening as we speak and which I'm following via Twitter, hashtag #tdwg) Joel Sachs asked me whether I had any specific data in mind that could form the basis of a discussion. So, here goes. I've assembled some small RDF data sets that it might be fun to play with. Each data set is for frogs, and I've divided them into two sets.

Primary data
These data sets are essentially unmodified RDF fetched from data providers:
  • uniprot.rdf Uniprot RDF for frogs in GenBank
  • ion.rdf Index of Organism Names (ION) RDF for taxonomic names for frogs (filtered to just those names that are also in GenBank, the RDF comes from ION LSIDs)
  • crossref.rdf CrossRef RDF for DOIs for publications that published new frog names (obtaining using CrossRef's support for Linked Data for DOIs)
  • dbpedia.rdf Dbpedia RDF for frogs in GenBank (Update 2011-10-20: the dbpedia.rdf file is a bit big, so here is subset.rdf which has just the conservation status and thumbnail image)


These sources give us information on genomics (at least, they tell us which taxa have been sequenced), where and when the original taxonomic description was published, and by whom, as well as some information on conservation status and what the frog looks like (via Dbpedia). Ideally we just load these files into a triple store and then ask a bunch of questions, such as what is the conservation status of frogs sequenced in Genbank?, is there correlation between the conservation status of a frog and the date it was discovered?, who has described the most frog species?, etc.

My contention is that actually we can't do any of this because the data is siloed due to the lack of shared identifiers and vocabularies (I suspect that there is not a single identifier any of these files share). The only way we can currently link these data sets together is by shared string literals (e.g., taxonomic names), in which case why bother with RDF? So my first challenge is to see whether any of the questions I've just listed can actually be tackled using this data.

Glue
In a slightly more constructive mode, to see if we can make progress I'm providing some additional RDF files, based on projects I'm working on to link data together. These files may help provide some of the missing "glue" to connect these data sets.

  • linkout.rdf The list of links between NCBI and Dbpedia (based on mapping in iPhylo LinkOut)
  • ion_doi.rdf A subset of publications listed in ION have DOIs, this file links the corresponding ION LSIDs to those DOIs (this file is from an ongoing project mapping names to primary literature)


The first file links the ION and CrossRef RDF, so we could start to ask questions about dates of discovery, who described what species, etc.. The second file links NCBI taxon ids (in this case in the form of UniProt URIs) to Wikipedia (in the form of Dbpedia URIs). Dbpedia has information on conservation status, and some frogs will also have pictures, so we can start to join genomics to conservation, as well as make some visualisations.

Update
I've now added another RDF file for 1000 georeferenced GenBank sequences for frogs. The file is genbank.rdf. This file is generated from a local, processed version of EMBL, and uses a mixture of Dublin Core and TDWG vocabularies. Here's an example of a single record:

<?xml version="1.0"?>
<rdf:RDF xmlns:dcterms="http://purl.org/dc/terms/"
xmlns:geo="http://www.w3.org/2003/01/geo/wgs84_pos#"
xmlns:owl="http://www.w3.org/2002/07/owl#"
xmlns:rdf="http://www.w3.org/1999/02/22-rdf-syntax-ns#"
xmlns:rdfs="http://www.w3.org/2000/01/rdf-schema#"
xmlns:tcommon="http://rs.tdwg.org/ontology/voc/Common#"
xmlns:toccurrence="http://rs.tdwg.org/ontology/voc/TaxonOccurrence#"
xmlns:uniprot="http://purl.uniprot.org/core/">
<uniprot:Molecule rdf:about="http://bio2rdf.org/genbank:EU566842">
<dcterms:created>2008-07-06</dcterms:created>
<dcterms:modified>2010-12-23</dcterms:modified>
<dcterms:title>EU566842</dcterms:title>
<dcterms:description>Xenopus borealis voucher MHNG:Herp:2644.64
cytochrome oxidase subunit I (COI) gene, partial cds; mitochondrial.</dcterms:description>
<dcterms:subject rdf:resource="http://purl.uniprot.org/taxonomy/8354"/>
<dcterms:relation rdf:parseType="Resource">
<rdf:type rdf:resource="http://rs.tdwg.org/ontology/voc/TaxonOccurrence#TaxonOccurrence"/>
<toccurrence:identifiedToString>Xenopus borealis</toccurrence:identifiedToString>
<toccurrence:decimalLatitude>0.66</toccurrence:decimalLatitude>
<geo:lat>0.66</geo:lat>
<toccurrence:decimalLongitude>37.5</toccurrence:decimalLongitude>
<geo:long>37.5</geo:long>
<toccurrence:verbatimCoordinates>0.66 N 37.5 E</toccurrence:verbatimCoordinates>
<toccurrence:country>Kenya</toccurrence:country>
<dcterms:identifier>MHNG:Herp:2644.64</dcterms:identifier>
</dcterms:relation>
</uniprot:Molecule>
</rdf:RDF>

I've added this simply so one could do some geographical queries.

Missing links
There are still lots of missing links here (for example, there's no explicit link between NCBI and ION, so we'd need to create this using taxonomic names), and we could add further links to the literature via sequences for taxa. Then there's the lack of geographic data. We could get some of this via georeferenced sequences in GenBank, but there's no RDF for this (Bio2RDF does have RDF for sequences but it ignores the bulk of the organismal metadata such as voucher specimens and latitude and longitude).

In many ways it's this lack of links that was point of my original email. The reality is that "linked data" isn't linked to anything like the extent that makes it useful. Simply pumping out RDF won't get us very far until we tackle this problem (see also my earlier post Linked data that isn't: the failings of RDF).

So, if you think RDF is the way to go, please tell me what you can learn from these data files.


Tuesday, April 12, 2011

Dark taxa: GenBank in a post-taxonomic world

How to cite: Page, R. (2011). Dark taxa: GenBank in a post-taxonomic world. https://doi.org/10.59350/xhvv2-xjt24
In an earlier post (Are names really the key to the big new biology?, I questioned Patterson et al.'s assertion in a recent TREE article (doi:10.1016/j.tree.2010.09.004) that names are key to the new biology.

In this post I'm going to revisit this idea by doing a quick analysis of how many species in GenBank have "proper" scientific names, and whether the number of named species has changed over time. My definition of "proper" name is a little loose: anything that had two words, second one starting with a lower case letter, was treated as a proper name. hence, a name like Eptesicus sp. A JLE-2010" is not a proper name, but Eptesicus andersoni is.

Mammals

Since GenBank started, every year has seen some 100-200 mammal species added to the database.


Until around 2003 almost all of these species had proper binomial names, but since then an increasing percentage of species-level taxa haven't been identified to species. In 2010 three-quarters of new tax_ids for mammals weren't identified.

Invertebrates

For "invertebrates" 2010 saw an explosive growth in the number of new taxa sequenced, with nearly 71,000 new taxa added to GenBank.


This coincides with a spectacular drop in the number of properly-named taxa, but even before 2010 the proportion of named invertebrate species in GenBank was in decline: in 2009 just over a half of the species added had binomials.

Bacteria

To put this in perspective, here are the equivalent graphs for bacteria.
Although at the outset most of the bacteria in GenBank had binomial names, pretty quickly the bulk of sequenced bacteria had informal names. In 2010 less than 1% of newly sequenced bacteria had been formerly described.

Dark taxa

For bacteria the graphs are hardly surprising. To get a proper name a bacterium must be cultured, and the vast majority of bacteria haven't been (or can't be) cultured. Hence, microbiologists can gloat at the nomenclatural mess plant and animal taxonomists have to deal with only because microbiologists have a tiny number of names to deal with.

For mammals and invertebrates there's clear a decline in the use of proper names.It would be tempting to suggest that this reflects a decline in the number of taxonomists - there might simply not be enough of them in enough groups to be able to identify and/or describe the taxa being sequenced.

However, if we look at the recent peaks of unnamed animal species, we discover that many have names like Lepidoptera sp. BOLD:AAD7075, indicating that they are DNA Barcodes from the Barcode of Life Data Systems. Of the 62,365 unnamed invertebrates added last year, 54,546 are BOLD sequences that haven't been assigned to a known species. Of the 277 unnamed mammals, 218 are BOLD taxa. Hence, DNA bnacording is flooding Genbank with taxa that lack proper names (and typically are represented by a single DNA bnacode sequence).

There are various ways to interpret these graphs, but for me the message is clear. The bulk of newly added taxa in GenBank are what we might term "dark taxa", that is, taxa that aren't identified to a known species. This doesn't necessarily mean that they are species new to science, we may already have encountered these species before, they may be sitting in museum collections, and have descriptions already published. We simply don't know. As the output from DNA barcoding grows, the number of dark taxa will only increase, and macroscopic biology starts to look a lot like microbiology.


A post-taxonomic world
If we look at the graphs for bacteria, we see that taxonomic names are virtually irrelevant, and yet microbiology seems to be doing fine as a discipline. So, perhaps it's time to think about a post-taxonomic world where taxonomic names, 
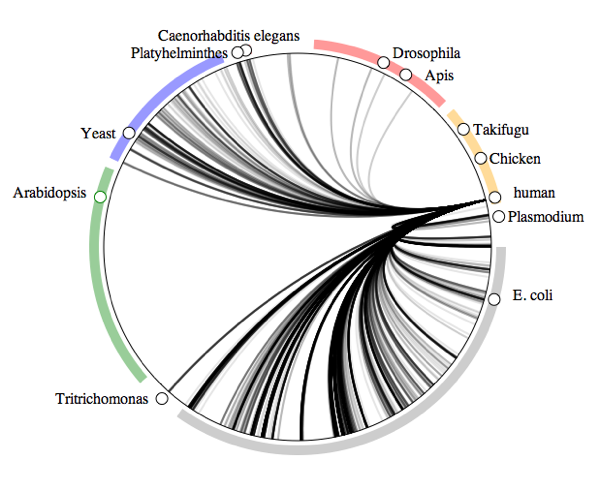
contra Patterson et al., are not that important. We can discover a good deal about organismal biology from GenBank alone (see my post Visualising the symbiome: hosts, parasites, and the Tree of Life for some examples, as well as Rougerie et al. 2010 doi:10.1111/j.1365-294X.2010.04918.x).

This leaves us with two questions:
  1. How much biology can we do without taxonomic names?
  2. If the lack of taxonomic names limits what we can do (and, playing devil's advocate, this is an open question) how can we speed up linking GenBank sequences to names?


I suspect that the answer to (1) is "quite a lot" (especially if we think like microbiologists). Question (2) is ultimately a question about how fast we can link literature, museum collections, sequences, and phylogenies. If progress to date is any indication, we need to rethink how we do this, and in a hurry, because dark taxa are accumulating at an accelerating rate.

How the analyses were done

Although the NCBI makes a dump of its taxonomic database available via FTP (at ftp://ftp.ncbi.nih.gov/pub/taxonomy/), this dump doesn't have dates for when the taxa were added to the database. However, using the Entrez EUtilities we can get the tax_ids that were published within a given date range. For example, to retrieve all the tax_ids added to the database in December 2010, we set the URL parameters &mindate=2010/12/01 and &maxdate=2010-12-31 to form this URL:

http://eutils.ncbi.nlm.nih.gov/entrez/eutils/esearch.fcgi?db=taxonomy&mindate=2010/12/01&maxdate=2010/12/31&retmax=1000000.

I've set &retmax to a big number to ensure I get all the tax_ids for that month (in this case 23511). I then made a local copy of the NCBI database in MySQL ( instructions here) and queried for all species-level taxa in GenBank. I used a rather crude regular expression REGEXP '^[A-Z][a-z]+ [a-z][a-z]+$' to find just those species names that were likely to be proper scientific names (i.e., no "sp.", "aff.", museum or voucher codes, etc.). To group the species into major taxonomic groups I used the division_id.

Results are available in a Google Spreadsheet.

Friday, March 25, 2011

Visualising the symbiome: hosts, parasites, and the Tree of Life

Back in 2006 in a short post entitled "Building the encyclopedia of life" I wrote that GenBank is a potentially rich source of information on host-parasite relationships. Often sequences of parasites will include information on the name of the host (the example I used was sequence AF131710 from the platyhelminth Ligophorus mugilinus, which records the host as the Flathead mullet Mugil cephalus).

I've always wanted to explore this idea a bit more, and have finally made a start, in part inspired by the recent VIZBI 2011 meeting. I've grabbed a large chunk of GenBank, mined the sequences for host records, and created some simple visualisations of what I'm terming (with tongue firmly in cheek) the "symbiome". Jonathan Eisen will not be happy, but I need a word that describes the complete set of hosts, mutualists, symbionts with which an organism is associated, and "symbiome" seems appropriate.

Human symbiome
To illustrate the idea, below is the human "symbiome". This diagram shows all the taxa in GenBank arranged in a circle, with lines connecting those organisms that have DNA sequences where humans are recorded as their host.

Human

At a glance, we have a lot of bacteria (the gray bar with E. coli) and fungi (blue bar with Yeast), and a few nematodes and arthropods.

Fig tree symbiome
Next up are organisms collected from fig trees (genus Ficus).

Ficus
Fig trees have wasp pollinators (the dark line landing near the honey bee Apis), as well as nematodes (dark line landing near Caenorhabditis elegans). There are also some associations with fungi and other arthropods.

Which taxa host insects?
Next up is a plot of all associations involving insects and a host.

Insect
The diagram is dominated by insect-flowering plant interactions, followed by insect-vertebrate associations (most likely bird and mammal lice).

Which taxa are hosted by insects?
We can reverse the question and ask what organisms are hosted by insects:

Insectashost
Lots of associations between insects and fungi, as well as bacteria, and a few other organisms, such as nematodes, and Plasmodium (the organism which causes malaria).

Frog symbiome
Lastly, below is the symbiome of frogs. "Worms" feature prominently, as well as the fungus that causes chytridiomycosis.

FrogHow the visualisation was made

The symbiome visualisations were made as follows. Firstly DNA sequences were downloaded from EMBL and run through a script that extracted as much metadata as possible, including the contents of the host field (where present). I then took the NCBI taxonomy and generated an ordered list of taxa by walking the tree in postorder, which determines where on the circumference of the circle the taxon lies. Pairs of taxa in an association are connected by a quadratic Bezier curve. The illustration was created using SVG.


Next steps
There are several ways this visualisation could be improved. It's based only only a subset of data (I haven't run all of the sequence databases though the parser yet), and the matching of host taxa is based on exact string matching. All manner of weird and wonderful things get entered in the host field, so we'll need some more sophisticated parsing (see "LINNAEUS: A species name identification system for biomedical literature" doi:10.1186/1471-2105-11-85 for a more general discussion of this issue).

The visualisation is fairly crude at this stage. Circle plots like this are fairly simple to create, and pop up in all sorts of situations (e.g., RNA secondary structure methods, which I did some work on years ago). Of course, Circos would be an obvious tool to use to create the visualisations, but the overhead of installing it and learning how to use it meant I took a shortcut and wrote some SVG from scratch.

Although I've focussed on GenBank as a source of data, this visualisation could also be applied to other data. I briefly touched on this in Tag trees: displaying the taxonomy of names in BHL where a page in the Biodiversity Heritage Library contains the names of a flea and it's mammalian hosts. I think these circle plots would be a great way to highlight possible ecological associations mentioned in a text.

Wednesday, October 29, 2008

OpenURL for Genbank records

Following on from adding specimens to my OpenURL resolver, I've added support for GenBank records. Either an OpenURL request such as http://bioguid.info/openurl?id=genbank:DQ502033, or the short URL http://bioguid.info/genbank/DQ502033 will resolve the GenBank record for accession number DQ502033.

The HTML isn't much to look at, the real goodness is the JSON (obtained by appending "&display=json" to the OpenURL request, or ".json" to the short form, e.g. http://bioguid.info/genbank/DQ502033.json).

The resolver gets the sequence form NCBI, does a little post processing, then displays the result. Postprocesisng includes parsing the latitude and longitude coordinates (something of a mess in GenBank, see my earlier metacrap rant), extracting specimen codes, adding bibliographic GUIDs (such as DOIs, Handles, or URLs), finding uBio namebankID's for hosts, etc. Note that some records have a key called "taxonomic_group". This is to provide clues for resolving museum specimens -- often the DiGIR provider needs to know what kind of taxon you are searching for.

The aim is to have a simple service that returns somewhat cleaned up GenBank records that I (and others) can play with.

Saturday, August 23, 2008

Reasons text mining will fail. I. UTM Grid References and GenBank accession numbers

OMG. Playing with extracting identifiers from text, I have a regular expression for GenBank accession numbers that looks something like this:
(A[A-Z])[0-9]{6} | (U[0-9]){5} | (D[A-Z])[0-9]{6} | (E[A-Z])[0-9]{6} | (NC_)[0-9]{6}).
OK, it won't get everything, but what is more worrying are the things it will pickup that aren't GenBank accession numbers.

For example, I ran Robert Mesibov's 2005 paper "The millipede genus Lissodesmus Chamberlin, 1920 (Diplopoda: Polydesmida:
Dalodesmidae) from Tasmania and Victoria, with descriptions of a new genus and 24 new species" [PDF here] through a script, and out came loads of GenBank accession numbers ... which is a worry as there aren't any sequences in this paper.

Turns out, Mesibov uses UTM grid references to describe localities, and these look like just GenBank accessions. There is a nice web site here which describes how UTM grid references are determined in Tasmania (from which the image below is taken).

Not all the "accession numbers" in Mesibov(2005) exist in GenBank, but some do, for example grid reference DQ402119 (41°26'31''S 146°17'02''E) is also a sequence DQ402119 and, you guessed it, it's not from a millipede. So, I need to be a little bit careful in extracting identifiers from text.

Wednesday, August 20, 2008

NCBI visualisations I - Genbank Timemap

Time for some fun. In between some tedious text mining I've been meaning to explore some visualisations of NCBI. Here's the first, inspired by Jörn Clausen's wonderful Live Earthquake Mashup (thanks to Donat Agosti for telling me about this). What I've done is take all the frog sequences in Genbank that are georeferenced, add the date those Genbank records were created, generate a KML file, and use Nick Rabinowitz's timemap to plot the KML. The result is here:


By dragging the time line you can see collections of sequences and where the frog samples came from. Clicking on a marker on the Google Map takes displays a link to the Genbank record. It's all pretty crude, but fun to play with. What I'm toying with is trying to do something like this for new taxa, i.e., a timemap showing where an when new species are described. Sort of a live biodiversity map like the earthquake mashup, albeit not quite so rapidly moving.