Rants, raves (and occasionally considered opinions) on phyloinformatics, taxonomy, and biodiversity informatics. For more ranty and less considered opinions, see my Twitter feed.
ISSN 2051-8188. Written content on this site is licensed under a Creative Commons Attribution 4.0 International license.
Wednesday, August 21, 2019
Ozymandias in Canberra
My talk discussed the Ozymandias knowledge graph, and also show cased the demos Nicole Kearney and I had put together to show the ways we think the ALA could be enhanced using knowledge graphs. One of these (linking names to the literature) has already been discussed here (see Messages from Melbourne: Towards linking all the things). The second demo (Hero images) gives examples of taxa for which ALA has no images, despite such images being available in the published literature via the Biodiversity Literature Repository. For example, the weevil genus Trigonopterus Fauvel, 1862 is richly illustrated in "Revision of the Australian species of the weevil genus Trigonopterus Fauvel" https://doi.org/10.3897/zookeys.556.6126. With a SPARQL query we can link these images to the associated taxa and provide a richer user experience.
The third demo makes use of Wikidata queries to display information on authors of taxonomic work on Australian species. This is very much a work in progress, but could be extended into a directory of Australian taxonomists.
One application of such a directory could be to determine to what extent Australian taxonomy depends on international researchers. Initial results (https://w.wiki/6PX) show that researchers from multiple countries have contribute to knowledge about Australian animal taxonomy and systematics.
There is still a frighteningly large amount of data cleaning and linking to do, but I think we've only scratched the surface of how knowledge graphs can be used to enrich biodiversity databases.
Monday, July 15, 2019
Notes on collections, knowledge graphs, and Semantic Web browsers
For some background on the Haystack project see How to Make a Semantic Web Browser DOI:10.1145/988672.988707 (PDF) and Haystack: A Customizable General-Purpose Information Management Tool for End Users of Semistructured Data PDF.
One reason I keep coming back to the Haystack project is the notion of having a personal space for exploring linked data. One of the challenges of having a large knowledge graph is that it becomes hard to have "local" queries. That is, queries which are restricted to a subset of things that you care about.
For example, while playing around with Ozymandias I keep coming across interesting species, such as Milyeringa justitia (see FIGURE 5 in A new species of the blind cave gudgeon Milyeringa (Pisces: Gobioidei, Eleotridae) from Barrow Island, Western Australia, with a redescription of M. veritas Whitley).
If I want to explore this taxon in more detail I'd like to have the original description, any relevant DNA sequences (e.g., MG543430), any papers publishing those sequences (e.g., Multiple molecular markers reinforce the systematic framework of unique Australian cave fishes (Milyeringa : Gobioidei)), and phylogenetic analyses such as the paper The First Record of a Trans-Oceanic Sister-Group Relationship between Obligate Vertebrate Troglobites which establishes a link between Milyeringa and a genus of cave fish endemic to Madagascar (Typhleotris).
What I'd like to be able to do is collect all these sources (ideally by simply bookmarking the links), saving them as a "collection", then at some point exploring what the knowledge graph can tell me. The importance of having a collection is so that I can tell the knowledge graph that I just want to explore a subset of information. Without a collection it can be tricky to limit the scope of queries. For example, given a global knowledge graph such as Wikidata, how would you query just species found in Australia? You would typically rely on the species having either a property ("found in Australia"), or perhaps an identifier that is only used for Australian species. Neither of these is particularly satisfactory, especially if there isn't a property that fortuitously matches the scope or your inquiry.
Hence, I'm interested in having collections: lists of entities that I want to know more about. I need ways to create these collections, ways to describe them, and ways to explore them. In some ways the collections feature of EOL was close to what I'm after. In the previous version of EOL you could "collect" taxa that you were interested in (for example, species that were blue) (see I think I now "get" the Encylopedia of Life). Sadly, collections (along with JSON-LD export and stable image URLs) have vanished from the new EOL (which seems to be in a death spiral driven by some really unfortunate decisions). And collections need to be able to contain any entity, not just taxa.
One way to represent collections in the linked data world is using RSS feeds, or their schema.org descendant, the DataFeed (see also Google's Data Feed Validation Tool). So, we could collect a series of things we are interested in, create the corresponding DataFeed, import that into our Knowledge Graph and that would give us a way to scope our queries (using membership of the DataFeed to select the species, papers, sequences, etc. that we are interested in). As an aside, there's also some overlap with another MIT project of old, David Huynh's Parallax project which explored querying on a set of objects, rather than one object at a time. This is the functionality that a collection gives you (if you have a query language like SPARQL which can work on sets of things).
Returning to Haystack, I'm intrigued by the idea of building a personal linked data browser. In other worlds, a browser that stores data that is relevant to projects you are working on (e.g., blind fish) as collections (data feeds), but can query a global knowledge graph to augment that information. SPARQL supports federated queries, so this is eminently doable. The local browser would have its own triple store, which could be implemented using Linked Data Fragments.
For now this is just a jumble of poorly articulated ideas, but I think much of the power of linking data together will be lost until we have simple tools that enable us to explore the data in ways that are relevant to what we actually want to know. Haystack gives us one model of what such a tool could look like.
Friday, June 21, 2019
Messages from Melbourne: Towards linking all the things
Brainstorming
The things we want to do are being captured as a project on GitHub. This is where we come up with ideas, comment on then, then try to figure out which ones can be done. So far there are three things we've made a serious start on.Unpaywall
Unpaywall is a project by Impactstory. It is sort of a Sci-Hub without the legal issues (for the record, I think Alexandra Elbakyan's work on Sci-Hub is nothing short of heroic). Unpaywall scans open access archives for legal, freely available versions of articles and makes them easy to find. If you have Firefox or Chrome you can get a plugin that lights up if the paywall article you're looking at has a free version somewhere else.Nicole has long wanted the BHL to provide data to Unpaywall, because BHL has open access versions of many papers relevant to taxonomy and biodiversity more broadly defined. After a bit of digging we figured out that Unpaywall didn't have access to BHL's data, so we've set about fixing that. We've got the data harvested, but we're still waiting for Unpaywall to process that data. So, for now, we're still waiting for the little green light to appear on pages such as this one: https://doi.org/10.1080/00222932208632640.
Adding taxonomic literature to Atlas of Living Australia
Part of "linking all the things" is making the taxonomic literature a first class citizen of biodiversity databases. It is frankly embarrassing to see how much better the scientific literature is handled by projects such as Wikipedia than scientific databases such as GBIF and the ALA. We've decided to try and do something about this by showing how easily the literature could be embedded into the existing ALA web site. Nicole crafted a mockup of the ALA names tab, and I wrote some code to make it "live". For example, if you click on this link you will see a list of publications for Pauropsalta herveyensis Owen & Moulds, 2016. Note that we have DOIs and links to BHL where ever possible (and we use Unpaywall's API to flag whether an article with a DOI is freely available). We want this literature (the primary evidence for what we know about a species) to be visible and accessible. The demo is powered by my Ozymandias project, but we hope to work out a mechanism for delivering the mapping between taxa and literature to ALA (and, indeed, anyone else) as a dataset.Because Ozymandias only has data for animals, we've had to exclude plants from this demo. I'm frantically trying to figure out how to work with data in Australia's plant name databases to resolve this. I'm discovering that never mind having more than one name for the same species, taxonomists also delight in having many different ways of representing taxonomic information in their databases. So, plants will be a challenge.
Mapping taxonomists to ORCID and Wikidata
One reason for adding literature to taxonomic databases is to make the work of taxonomists more visible. One way to do this is to move beyond using only "dumb strings" as people names and linking taxonomists to their ORCIDs and to entries in Wikidata (this is something I touched on in Ozymandias, and David Shorthouse is doing on an epic scale in Bloodhound). We're playing with the idea of being able to generate a list of active taxonomists in Australia, linked to their identifiers and publications, solely based on querying Wikidata. The first step is to try and automate the initial mapping between taxonomists and Wikidata as much as possible, we've only just started looking at this.Summary
It is early days, and we're still identifying things we could work on. As always, there are so manythings which could be done, we're hoping we can make progress on at least some of these in the next few weeks.Tuesday, May 28, 2019
Frankenplace, geospatial search, and discrete global grid systems
Quick note on Frankenplace, a cool search tool that displays the geographic distribution of documents that match the user's query as a heatmap. Details of how the tool works are given in:
B. Adams, G. McKenzie, and M. Gahegan (2015) Frankenplace: Interactive Thematic Mapping for Ad Hoc Exploratory Searching. 24th International World Wide Web Conference (WWW 2015), http://dx.doi.org/10.1145/2736277.2741137At the heart of the method is a discrete global grid that divides the world up into small areas of the same size. Topics are then geographically indexed, so that when a user searches, say, for "ebola", areas relevant to that query are highlighted (in this case, areas in Africa). It's striking example of querying data geographically, and one which I hope to explore further in the context of BHL and BioStor.
Update
I've put some notes on various discrete global grid systems in a repo on GitHub: RDF and discrete global grid systems.
Ozymandias meets Wikipedia, with notes on natural language generation
These snippets come from Wikipedia, well actually, from the DBpedia project. Behind the scenes I have a script that takes the GBIF taxon id for an ALA taxon (if it exists), queries Wikidata for the corresponding taxon and any associate identifiers of interest, and if there's a link to an English language Wikipedia page I do a quick SPARQL query to DBpedia to retrieve the snippet of text. At some point all of this could be sped up by adding the relevant data to the triple store and doing the query locally but for now it works well enough.
Of course, many snippets are little more than stubs, e.g. the snippet for another dung beetle genus Diorygopyx doesn't tell us much more than we can get from the information already displayed.
But having a text summary still seems worthwhile, which raises the question of what to do when Wikipedia doesn't know anything about a taxon? Obviously, we could start editing Wikipedia to flesh out its content, but that will take a while to filter into databases such as DBpedia. Another approach is to generate snippets from the triple store itself, in other words, generate natural language summaries from structured data. For example, we could generate summaries such as "Diorygopyx is a genus of Scarabaeidae or scarab beetles in the superfamily Scarabaeoidea" fairly easily from knowing the taxonomic hierarchy and a few common names. But we could also do more. In browsing Ozymandias I'm struck at times by how much our knowledge of one taxon depends on a major piece of taxonomic work, often done some time ago. For example, The Australian Crickets (Orthoptera: Gryllidae). Academy of Natural Sciences of Philadelphia, Monograph 22 by Otte and Alexander (1983) is a monumental taxonomic monograph, and many Australian cricket genera had most (or all) of their species described in that work. Imagine having a snippet that mentioned that (e.g., "Most species in this genus were described in 1983, no species have been discovered since."). That would give the reader some useful information, and perhaps also prompt them to ask "so, why haven't any more species been described?".
I think there's scope here to make the output from triple stores (and other databases) more approachable using natural language generation. This is obviously a big area, and there are some very sophisticated approaches for outputting very natural language (think chatbots), perhaps the most striking example of which is Google Duplex.
But we don't need quite this level of sophistication, something using much simpler techniques (e.g., nalgene-js) would probably be enough. Armed with some basic facts from the triple store, and some simple templates, we could probably generate some useful text snippets for many taxa in Ozymandias, and indeed for other entities. For example, David Shorthouse is outputting simple text summaries of the contribution of taxonomists to specimen collection and identification:
Arthur Loveridge identified Scolecomorphidae and collected Chamaeleonidae https://t.co/NimKzmUuOX— Bloodhound (@BloodhoundTrack) May 24, 2019
Imagine extending this to take into account publications, geography, etc. I think there's lots of scope here for moving beyond just displaying data and trying to generate human-friendly summaries of data.
Wednesday, April 10, 2019
Ozymandias: A biodiversity knowledge graph published in PeerJ
Hey @rdmpage , really enjoyed reading your Ozymandias paper. Are your assembled triples graphs are available for bulk download?— Carl Boettiger (@cboettig) April 9, 2019
Carl Boettiger (@cboettig) asked where the triples were, as did Kingsley Uyi Idehen (@kidehen). Doh! This is one thing I should have done as part of the paper. I've uploaded the triples to Zenodo, you can find them here: https://doi.org/10.5281/zenodo.2634326.
by omitting @plazi_ch, #taxontreatment, and #taxpub, @rdmpage deprives us from 99% of the knowledge about #biodiversity that is IN the publication & increasingly available: PDF (https://t.co/gKwHi2Kzx6) -> https://t.co/QlNgEG5w2a, https://t.co/bloWpDKmny, https://t.co/RxBdD5WlTj https://t.co/dVEaNANatl— Donat Agosti (@myrmoteras) April 9, 2019
Donat Agosti (@myrmoteras) complained that my knowledge graph ignored a lot of available information, which is true in the sense that I restricted it to a core of people, publications, taxa, and taxonomic names. The Plazi project that Donat champions extracts, where possible, lots of detail from individual publications, including figures, text blocks corresponding to taxonomic treatments, and in some cases geographic and specimen information. I have included some of this information in Ozymandias, specifically figures for papers where they are available. For example, Figure 10 from the paper "Australian Assassins, Part I: A review of the Assassin Spiders (Araneae, Archaeidae) of mid-eastern Australia":
This figure illustrates Austrarchaea nodosa (Forster, 1956), and Plazi has a treatment of that taxon: http://treatment.plazi.org/id/1072F469192A5BA015A1AA70A36E2C92. This treatment comprises a series of text blocks extracted from the paper, so there is not a great deal I can do with this unless I want to parse the text (e.g., for geographical coordinates and specimen codes). So yes, there is RDF (see http://treatment.plazi.org/GgServer/rdf/1072F469192A5BA015A1AA70A36E2C92) but it adds little to the existing knowledge graph.
To be fair, for some treatments in Plazi are a lot richer, for example http://tb.plazi.org/id/A94487F7E15AFFA5FF682EE9FEB45F2C which has references, geographical coordinates, and more. What would be useful would be an easy way to explore Plazi, for example, if the RDF was dumped into a triple store where we could explore it in more detail. I hope to look into this in the coming weeks.
Sunday, March 24, 2019
Where is the damned collection? Wikidata, GrBio, and a global list of all natural history collections
When Schindel et al. came out I suggested that a better way forward was to use Wikidata as the data store for basic information on collections (see GRBio: A Call for Community Curation - what community?). David Shorthouse's work on linking individual researchers to the specimens they have collected (Bloodhound) has motivated me to revisit this. One of the things David is wants to do is link the work of individuals to the institutions that host the specimens they work on. For individuals the identifier of choice is ORCID, and many researcher's ORCID profiles have identifiers for the institution they work at. For example, my ORCID profile https://orcid.org/0000-0002-7101-9767 states that I work at Glasgow University which has the Ringgold number of 3526. What is missing here is a way to go from the institutional identifiers we use for specimens (e.g., abbreviations like "MCZ" for the Museum of Comparative Zoology) to identifier such as Ringgold that organisations such as ORCID use.
It turns out that many institutions with Ringgold numbers (and other identifiers, such as Global Research Identifier Database or GRID) are in Wikidata. So, if we could map museum codes (institutionCode in Darwin Core terms) to Wikidata, then we can close the loop and have common institutional identifiers for both where individuals are employed and the institutions that house the collections that they work on.
Hence, it seems to me that using Wikidata as the basis for a global catalogue of institutions housing natural history collections makes a lot of sense. Many of these institutions are already in Wikidata, and the community of Wikidata editors dwarfs the number of people likely to edit a domain-specific database (as evidenced by the failure of GrBio's call for community engagement with its database). Furthermore, Wikidata has a sophisticated editing interface, with support for multiple langages and adding the provenance of individual data entries.
Here are some more examples:
- NHMUK - Natural History Museum London
- P - Muséum national d'histoire naturelle
- WAM - Western Australian Museum
- HZM - Harrison Institute
- PE - 中国科学院植物研究所植物标馆是
There are some challenges to using Wikidata for this purpose. To date there has been little in the way of a coordinated effort to add natural history collections. There are 121 institutions that have a Index Herbariorum code (Property P5858) associated with their Wikidata records, you can see a list here. There is also a property for Biodiversity Repository ID which supports the syntax GrBio used to create unique institutionCode's even when multiple institutions used the same code. This has had limited uptake so far only being a property for five Wikidata items.
However, there are more museums and herbaria in Wikidata. For example, if we search for herbaria, natural history museums, and zoological museums we find 387 institutions. This query is made harder than it should because there are multiple types that can be used to describe a natural history collection and they query only uses three of them.
Another source of entries in Wikidata is Wikispecies. There are two pages (Repositories (A–M) and Repositories (N–Z)) that list pages corresponding to different institutionCodes. I have harvested these and found 1298 of these in Wikidata. This indicates that a good fraction of the 7,097 institutions listed by GrBio already have a presence in Wikidata. At the same time, it rather complicates the task of adding institutions to Wikidata as we need to figure out how many of these stub-like entries based on institutionCodes represent institutions already in Wikidata. There are also https://en.wikipedia.org/wiki/List_of_herbaria and natural history museums on Wikipedia that can also be harvested and cross-referenced with Wikidata.
So, there is a formidable data cleaning task ahead, but I think it's worth contemplating. One thing I find particularly interesting are the links to social media profiles, such as Twitter, Facebook, and Instagram. This gives another perspective on these institutions - in a sense this is digitisation of experiences that one can have at those institutions. These profiles are also often a good sources of data (such as geographic location and address). And they give a foretaste of what I think we can do. Imagine the entire digital footprint of a museum or herbarium being linked together in one place: the social media profiles, the digitised collections, the publications for which it is a publisher, its membership in BHL, JSTOR, GBIF, and other initiatives, and so on. We could start to get a better sense of the impact of digitisation - broadly defined - on each institution.
In summary, I think the role of Wikidata in cataloguing collections is worth exploring, and there's a discussion of this idea going on at the GBIF Community Forum. It will be interesting to see where this discussion goes. Meantime, I'm messing about developing with some scripts to see how much of the data mapping and cleaning process can be automated, so that tools like Where is the damned collection? become more useful.
References
- Schindel, D., Miller, S., Trizna, M., Graham, E., & Crane, A. (2016). The Global Registry of Biodiversity Repositories: A Call for Community Curation. Biodiversity Data Journal, 4, e10293. doi:10.3897/bdj.4.e10293
- Sharma, S., Ciufo, S., Starchenko, E., Darji, D., Chlumsky, L., Karsch-Mizrachi, I., & Schoch, C. L. (2018). The NCBI BioCollections Database. Database, 2018. doi:10.1093/database/bay006
- Taylor, M. A. (2016). “Where is the damned collection?” Charles Davies Sherborn’s listing of named natural science collections and its successors. ZooKeys, 550, 83–106. doi:10.3897/zookeys.550.10073
Wednesday, December 05, 2018
Glasgow University's Institute of Biodiversity, Animal Health & Comparative Medicine, where I'm based, hosts Naturally Speaking featuring "cutting edge research and ecology banter". Apparently, what I do falls into that category, so Episode 65 features my work, specifically my entry for the 2018 GBIF Challenge (Ozymandias). The episode page has a wonderful illustration by Eleni Christoforou which captures the idea of linking things together very nicely. Making the podcast was great fun, thanks to the hosts Kirsty McWhinnie and Taya Forde. Let's face it, what academic doesn't love to talk about their own work, given half a chance? I confess I'm happy to talk about my work, but I haven't had the courage yet to listen to the podcast.
Ozymandias: A biodiversity knowledge graph available as a preprint on Biorxiv
I've written up my entry for the 2018 GBIF Challenge ("Ozymandias") and posted a preprint on Biorxiv (https://www.biorxiv.org/content/early/2018/12/04/485854). The DOI is https://doi.org/10.1101/485854 which, last time I checked, still needs to be registered.
The abstract appears below. I'll let the preprint sit there for a little while before I summon the enthusiasm to revisit it, tidy it up, and submit it for publication.
Enormous quantities of biodiversity data are being made available online, but much of this data remains isolated in their own silos. One approach to breaking these silos is to map local, often database-specific identifiers to shared global identifiers. This mapping can then be used to con-struct a knowledge graph, where entities such as taxa, publications, people, places, specimens, sequences, and institutions are all part of a single, shared knowledge space. Motivated by the 2018 GBIF Ebbe Nielsen Challenge I explore the feasibility of constructing a "biodiversity knowledge graph" for the Australian fauna. These steps involved in constructing the graph are described, and examples its application are discussed. A web interface to the knowledge graph (called "Ozymandias") is available at https://ozymandias-demo.herokuapp.com.
Thursday, November 15, 2018
Geocoding genomic databases using GBIF
I've put a short note up on bioRxiv about ways to geocode nucleotide sequences in databases such as GenBank. The preprint is "Geocoding genomic databases using GBIF" https://doi.org/10.1101/469650.
It briefly discusses using GBIF as a gazetteer (see https://lyrical-money.glitch.me for a demo) to geocode sequences, as well as other approaches such as specimen matching (see also Nicky Nicolson's cool work "Specimens as Research Objects: Reconciliation across Distributed Repositories to Enable Metadata Propagation" https://doi.org/10.6084/m9.figshare.7327325.v1).
Hope to revisit this topic at some point, for now this preprint is a bit of a placeholder to remind me of what needs to be done.
Thursday, October 25, 2018
Taxonomic publications as patch files and the notion of taxonomic concepts
There's a slow-burning discussion on taxonomic concepts on Github that I am half participating in. As seems inevitable in any discussion of taxonomy, there's a lot of floundering about given that there's lots of jargon - much of it used in different ways by different people - and people are coming at the problem from different perspectives.
In one sense, taxonomy is pretty straightforward. We have taxonomic names (labels), we have taxa (sets) that we apply those labels to, and a classification (typically a set of nested sets, i.e., a tree) of those taxa. So, if we download, say, GenBank, or GBIF, or BOLD we can pretty easily model names (e.g., a list of strings), the taxonomic tree (e.g., a parent-child hierarchy), and we have a straightforward definition of the terminal taxa (leaves) or the tree: they comprise the specimens and observations (GBIF), or sequences (GenBank and BOLD) assigned to that taxon (i.e., for each specimen or sequence we have a pointer to the taxon to which it belongs).
Given this, one response to the taxonomic concept discussion is to simply ignore it as irrelevant, and we can demonstrably do a lot of science without it. I suspect most people dealing with GBIF and GenBank data aren't aware of the taxonomic concept issue. Which begs the question, why the ongoing discussion about concepts?
Perhaps the fundamental issue is that taxonomic classification changes over time, and hence the interpretation of a taxon can change over time. In other words, the problem is one of versioning. Once again, the simplest strategy to deal with this is simply use the latest version. In much the same way that most of us probably just read the latest version of a Wikipedia page, and many of us are happy to have our phone apps update automatically, I suspect most are happy to just grab the latest version and do some, you know, science.
I think taxonomic concepts really become relevant when we are aggregating data from sources where the data may not be current. In other words, where data is associated with a particular taxonomic name and the interpretation of that name has changed since the last time the data was curated. If the relationships of a taxon or specimen can be computed on the fly, e.g. if the data is a DNA barcode, then this issue is less relevant because we can simply re-cluster the sequences and discover where the specimen with that sequence belongs in a new classification. But for many specimens we don't have sufficient information to do this computation (this is one reason DNA barcodes are so useful, everything needed to determine a barcode's relationship is contained in the sequence itself).
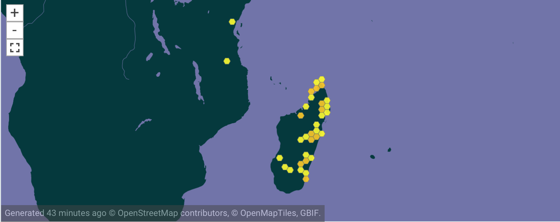
To make this concrete, consider the genus Brookesia in GBIF (GBIF:2449310.
According to Wikipedia Brookesia is endemic to Madagascar, so why does it appear on the African mainland? There are two records from Africa, Brookesia brookesia ionidesi collected in 1957 and Brookesia temporalis collected in 1926. Both represent taxa that were in the genus Brookesia at one point, but are now in different genera. So our notion of Brookesia has changed over time, but curation of these records has yet to catch up with that.
So, what would be ideal would be if we have a timestamped series of classifications so that we could go back in time and see what a given taxon meant at a given time, and then go forward to see the status of that taxon today. Having such a timestamped series is not a trivial task, indeed it may only be available in well studied groups. Birds are one such group, where each year eBird updates the current bird classification based on taxonomic activity over the previous year. As part of the Github discussion I posted visual "diff" between two bird classifications:
You can see the complete diff here, and the blog post Visualising the difference between two taxonomic classifications for details on the method.. The illustration above shows the movement of one species from Sasia to Verreauxia.
So, given two classifications we can compute the difference between them, and represent that difference as an "edit script" or operations to convert one tree into another. These edits are essentially what taxonomists do when they revise a group, they do things such as move species form one genus to another, merge some taxa, sink others into synonymy, and so on. So, taxonomy is essentially creating a series of edit files ("patches") to a classification. At a recent workshop in Ottawa Karen Cranston pointed out that the Open Tree of Life has been accumulating amendments to their classification and that these are essentially patch files.
Hence, we could have a markup language for taxonomic work that described that work in terms of edit operations that can then be automatically applied to an existing classification. We could imagine encoding all the bird taxonomy for a year in this way, applying those patches to the previous years' tree, and out pops the new classification. The classification becomes an evolving document under version control (think GitHub for trees). Of course, we'd need something to detect whether two different papers were proposing incompatible changes, but that's essentially a tree compatibility problem.
One way to store version information would be to use time-based versioned graphs. Essentially, we start with each node in the classification tree having a start date (e.g., 2017) and an open-ended end date. A taxonomic work post 2017 that, say, moved a species from one genus to another would set the end date for the parent-child link between genus and species, and create a new timestamped node linking the species to its new genus. To generate the 2018 classification we simply extract all links in the tree whose date range includes 2018 (which means the old generic assignment for the species is not included). This approach gives us a mechanism for automating the updating of a classification, as well as time-based versioning.
I think something along these lines would create something useful, and focus the taxonomic discussion on solving a specific problem.
Wednesday, October 24, 2018
Specimens, collections, researchers, and publications: towards social and citation graphs for natural history collections
Being in Ottawa last week for a hackathon meant I could catch up with David Shorthouse (@dpsSpiders. David has been doing some neat work on linking specimens to identifiers for researchers, such as ORCIDs, and tracking citations of specimens in the literature.
David's Bloodhound tool processes lots of GBIF data for occurrences with names of those who collected or identified specimens. If you have an ORCID (and if you are a researcher you really should) then you can "claim" your specimens simply by logging in with your ORCID. My modest profile lists New Zealand crabs I collected while an undergraduate at Auckland University.
Unlike many biodiversity projects, Bloodhound is aimed squarely at individual researchers, it provides a means for you to show your contribution collecting and identifying the world's biodiversity. This raises the possibility of one day being able to add this information to your ORCID profile (in the way that currently ORCID can record your publications, data sets, and other work attached to a DOI). As David explains:
A significant contributing factor for this apparent neglect is the lack of a professional reward system; one that articulates and quantifies the breadth and depth of activities and expertise required to collect and identify specimens, maintain them, digitize their labels, mobilize the data, and enhance these data as errors and omissions are identified by stakeholders. If people throughout the full value-chain in natural history collections received professional credit for their efforts, ideally recognized by their administrators and funding bodies, they would prioritize traditionally unrewarded tasks and could convincingly self-advocate. Proper methods of attribution at both the individual and institutional level are essential.
Attribution at institutional level is an ongoing theme for natural history collections: how do they successfully demonstrate the value of their collections?
REMINDER: If you cite museum specimens in publications, let us know and send us a copy. WE LINK YOUR RESEARCH TO OUR COLLECTION FOREVER. It's like super important to science.
— Mark Carnall (@mark_carnall) October 24, 2018
Mark Carnall's (@mark_carnall) tweet illustrates the mismatch between a modern world of interconnected data and the reality of museums trying to track usage of their collections by requesting reprints. The idea of tracking citations of specimens and or collections has been around for a while. For example, I did some work text mining BioStor for museum specimen codes, Ross Mounce and Aime Rankin have worked on tracking citations of Natural History Museum specimens (https://github.com/rossmounce/NHM-specimens), and there is the clever use of Google Scholar by Winker and Withrow (see The impact of museum collections: one collection ≈ one Nobel Prize and https://doi.org/10.1038/493480b).
David has developed a nice tool that shows citations of specimens and/or collections from the Canadian Museum of Nature.
I'm sure many natural history collections would love a tool like this!
Note the altmetric.com "doughnuts" showing the attention each publication is receiving. These doughnuts are possible only because the publishing industry got together and adopted the same identifier system (DOIs). The existence of persistent identifiers enables a whole ecosystem to emerge based around those identifiers (and services to support those identifiers).
The biodiversity community has failed to achieve something similar, despite several attempts. Part of the problem is the cargo-cult obsession with "identifiers" rather than focussing on the bigger picture. So we have various attempts to create identifiers for specimens (see "Use of globally unique identifiers (GUIDs) to link herbarium specimen records to physical specimens" https://doi.org/10.1002/aps3.1027 for a review), but little thought given to how to build an ecosystem around those identifiers. We seem doomed to recreate all the painful steps publishers went through as created a menagerie of identifiers (e.g., SICIs, PII) and alternative linking strategies ("just in time" versus "just in case") until they settled on managed identifiers (DOIs) with centralised discovery tools (provided by CrossRef).
Specimen-level identifiers are potentially very useful, especially for cross linking records in GBIF, GenBank, and BOLD, as well as tracking citations, but not every taxonomic community has a history of citing specimens individually. Hence we may also want count citations at collection and institutional level. Once again we run into the issue that we lack persistent, widely used identifiers. The GRBio project to assign such identifiers has died, despite appeals to the community for support (see GRBio: A Call for Community Curation - what community?). Given Wikidata's growing role as an identity broker, a sensible strategy might be to focus on having every collection and institution in Wikidata (many are already) and add the relevant identifiers there. For example, Index Herbarium codes are now a recognised property in Wikidata, as seen in the entry for Cambridge University Herbarium (CGE).
But we will need more than technical solutions, we will also need compelling drivers to track specimen and collection use. The success of CrossRef has been due in part to the network effects inherent in the citation graph. Each publisher has a vested interest in using DOIs because other CrossRef members will include those DOIs in the list of literature cited, which means that each publisher potentially gets traffic from other members. Companies like altmetric.com (of doughnut fame) make money by selling data on attention papers receive to publishers and academic institutions, based on tracking mention of identifiers. Perhaps natural history collections should follow their lead and ask how they can get an equivalent system, in other words, how do we scale tools such as the Canadian Museum of Nature citation tracker across the whole network? And in particular, what services do you want and how much would those services be worth to you?
Ottawa Ecobiomics hackathon: graph databases and Wikidata
I spent last week in Ottawa at a "Ecobiomics" hackathon organised by Joel Sachs. Essentially we spent a week exploring the application of linked data to various topics in biodiversity, with an emphasis on looking at working examples. Topics covered included:
- a live demo of Metaphacts
- a Semantic Mediawiki version of the Flora of North America
- using linked data to study food webs
- OpenBioDiv
In addition to the above I spent some of the time working on encoding GBIF specimen data in RDF with a view to adding this to Ozymandias. Having Steve Baskauf (@baskaufs) at the workshop was a great incentive to work on this, given his work with Cam Webb on Darwin-SW: Darwin Core-based terms for expressing biodiversity data as RDF.
A report is being written up which will discuss what we got up to in more detail, but one take away for me is the large cognitive burden that still stands in the way of widespread adoption of linked data approaches in biodiversity. Products such as Metaphactory go some way to hiding the complexity, but the overhead of linked data is high, and the benefits are perhaps less than obvious. Update: for more o this see Dan Brickley's comments on "Semantic Web Interest Group now closed".
In this context, the rise of Wikidata is perhaps the most important development. One thing we'd hoped to do but didn't get that far was to set up our own instance of Wikibase to play with (Wikibase is the software that Wikidata runs on). This is actually pretty straightforward to do if you have Docker installed, see this great post in Medium Wikibase for Research Infrastructure — Part 1 by Matt Miller, which I stumbled across after discovering Bob DuCharme's blog post Running and querying my own Wikibase instance. Running Wikibase on your own machine (if you follow the instructions you also get the SPARQL query interface) means that you can play around with a knowledge graph without worrying about messing up Wikidata itself, or having to negotiate with the Wikidata community if you want to add new properties. It looks like a relatively painless way to discover whether knowledge graphs are appropriate for the problem you're trying to solve. I hope to find time to play with Wikibase further in the future.
I'll update this blog post as the hackathon report is written.
GBIF Ebbe Nielsen Challenge update
🎉 🎉 CONGRATULATIONS to @UofGlasgow's @rdmpage for winning joint first prize in the 2018 @GBIF Ebbe Nielsen Challenge, the annual innovation competition to advance open science and open data for biodiversity. Well done, Prof Page! @IBAHCM #UofGWorldChangers pic.twitter.com/DjbmP90hTN
— UofG MVLS (@UofGMVLS) October 17, 2018
Quick note to express my delight and surprise that my entry for the 2018 GBIF Ebbe Nielsen Challenge come in joint first! My entry was Ozymandias - a biodiversity knowledge graph which built upon data from sources such as ALA, AFD, BioStor, CrossRef, ORCID), Wikispecies, and BLR.
I'm still tweaking Ozymandias, for example adding data on GBIF specimens (and maybe sequences from GenBank and BOLD) so that I can explore questions such as what is the lag time between specimen collection and description of a species. The bigger question I'm interested in is the extent to which knowledge graphs (aka RDF) can be used to explore biodiversity data.
For details on the other entries visit the list of winners at GBIF. The other first place winners Lien Reyserhove, Damiano Oldoni and Peter Desmet have generously donated half their prize to NumFOCUS which supports open source data science software:
Let’s give back! ❤️We decided to donate half of our @GBIF prize money (5000€) to @NumFOCUS which funds essential #opensource research software like @rOpenSci, #pandas and @ProjectJupyter. https://t.co/R3Bh0Tj8YX
— LifeWatch INBO (@LifeWatchINBO) October 18, 2018
This is a great way of acknowledging the debt many of us owe to developers of open source software that underpins the work of many researchers.
I hope GBIF and the wiser GBIF community found this year's Challenge to be worthwhile, I'm a big fan of anything which increases GBIF's engagement with developers and data analysts, and if the challenge runs again next year I encourage anyone with an interest in biodiversity informatics to consider taking part.
Tuesday, September 11, 2018
Guest post - Quality paralysis: a biodiversity data disease
The following is a guest post by Bob Mesibov.
In 2005, GBIF released Arthur Chapman's Principles of Data Quality and Principles and Methods of Data Cleaning: Primary Species and Species-Occurrence Data as freely available electronic publications. Their impact on museums and herbaria has been minimal. The quality of digitised collection data worldwide, to judge from the samples I've audited (see disclaimer below), varies in 2018 from mostly OK to pretty awful. Data issues include:
- duplicate records
- records with data items in the wrong fields
- records with data items inappropriate for a given field (includes Chapman's "domain schizophrenia")
- records with truncated data items
- records with items in one field disagreeing with items in another
- character encoding errors and mojibake
- wildly erroneous dates and spatial coordinates
- internally inconsistent formatting of dates, names and other data items (e.g. 48 variations on "sea level" in a single set of records)
In a previous guest post I listed 10 explanations for the persistence of messy data. I'd gathered the explanations from curators, collection managers and programmers involved with biodiversity data projects. I missed out some key reasons for poor data quality, which I'll outline in this post. For inspiration I'm grateful to Rod Page and to participants in lively discussions about data quality at the SPNHC/TDWG conference in Dunedin this August.
- Our institution, like all natural history collections these days, isn't getting the curatorial funding it used to get, but our staff's workload keeps going up. Institution staff are flat out just keeping their museums and herbaria running on the rails. Staff might like to upgrade data quality, but as one curator wrote to me recently, "I simply don't have the resources necessary."
- We've been funded to get our collections digitised and/or online, but there's nothing in the budget for upgrading data quality. The first priority is to get the data out there. It would be nice to get follow-up funding for data cleaning, but staff aren't hopeful. The digitisation funder doesn't seem to think it's important, or thinks that staff can deal with data quality issues later, when the digitisation is done.
- There's no such thing as a Curator of Data at our institution. Collection curators and managers are busy adding records to the collection database, and IT personnel are busy with database mechanics. The missing link is someone on staff who manages database content. The bigger the database, the greater the need for a data curator, but the usual institutional response is "Get the collections people and the IT people together. They'll work something out."
- Aggregators act too much like neutrals. We're mobilising our data through an aggregator, but there are no penalties if we upload poor-quality data, and no rewards if we upload high-quality data. Our aggregator has a limited set of quality tests on selected data fields and adds flags to individual records that have certain kinds of problems. The flags seem to be mainly designed for users of our data. We don't have the (time/personnel/skills) to act on this "feedback" (or to read those 2005 GBIF reports).
There's a 15th explanation that overlaps the other 14 and Rod Page has expressed it very clearly: there's simply no incentive for anyone to clean data.
- Museums and herbaria don't get rewards, kudos, more visitors, more funding or more publicity if staff improve the quality of their collection data, and they don't get punishments, opprobrium, fewer visitors, reduced funding or less publicity if the data remain messy.
- Aggregators likewise. Aggregators also don't suffer when they downgrade the quality of the data they're provided with.
- Users might in future get some reputational benefit from alerting museums and herbaria to data problems, through an "annotation system" being considered by TDWG. However, if users clean datasets for their own use, they get no reward for passing blocks of cleaned data to overworked museum and herbarium staff, or to aggregators, or to the public through "alternative" published data versions.
With the 15 explanations in mind, we can confidently expect collection data quality to remain "mostly OK to pretty awful" for the foreseeable future. Data may be upgraded incrementally as loans go out and come back in, and as curators, collection managers and researchers compare physical holdings one-by-one with their digital representations. Unfortunately, the improvements are likely to be overwhelmed by the addition of new, low-quality records. Very few collection databases have adequate validation-on-entry filters, and staff don't have time for, or assistance with checking. Or a good enough reason to check.
"Quality paralysis" is endemic in museums and herbaria and seems likely to be with us for a long time to come.
DISCLAIMER: Believe it or not, this post isn't an advertisement for my data auditing services.
I began auditing collection data in 2012 for my own purposes and over the next few years I offered free data auditing to a number of institutions in Australia and elsewhere. There were no takers.
In 2017 I entered into a commercial arrangement with Pensoft Publishers to audit the datasets associated with data papers in Pensoft journals, as a free Pensoft service to authors. Some of these datasets are based on collections data, but when auditing I don't deal with the originating institutions directly.
I continue to audit publicly available museum and herbarium data in search of raw material for my website A Data Cleaner's Cookbook and its companion blog BASHing data. I also offer free training in data auditing and cleaning.
Monday, August 20, 2018
GBIF Challenge Entry: Ozymandias
I've submitted an entry for the 2018 GBIF Ebbe Nielsen Challenge. It's a couple of weeks before the deadline but I will be away then so have decided to submit early.
My entry is Ozymandias - a biodiversity knowledge graph. The name is a play on "Oz" being nickname for Australia (much of the data for the entry comes from Australia), and Ozymandias, which is a poem about hubris, and attempting to link biodiversity data requires a certain degree of hubris.
The submission process for the challenge is unfortunately rather opaque compared to previous years when entries were visible to all, so participants could see what other people were submitting, and also knew the identity of the judges, etc. In the spirit of openness here is my video summarising my entry:
Ozymandias - GBIF Challenge Entry from Roderic Page on Vimeo.
There is also a background document here: https://docs.google.com/presentation/d/1UglxaL-yjXsvgwn06AdBbnq-HaT7mO4H5WXejzsb9MY/edit?usp=sharing.I suspect this entry is not at all what the challenge is looking for, but I've used the challenge as a deadline so that I get something out the door rather than endlessly tweaking a project that only I can see. There will, of course, be endless tweaking as I explore further ways to link data, but at least this way there is something people can look at. Now, I need to spend some time writing up the project, which will require yet more self discipline to avoid the endless tweaking.
Friday, August 17, 2018
Ozymandias demo
I've made a video walkthrough of Ozymandias, which I described in this post. It's a bit, um, long, so I'll need to come up with a shorter version.
Ozymandias - a biodiversity knowledge graph from Roderic Page on Vimeo.
Friday, August 10, 2018
Ozymandias: a biodiversity knowledge graph of Australian taxa and taxonomic publications
In the spirit of release early and release often, here is the first workable version of a biodiversity knowledge graph that I've been working on for Australian animals (for some background on knowledge graphs see Towards a biodiversity knowledge graph now in RIO). The core of this knowledge graph is a classification of animals from the Atlas of Living Australia (ALA) combined with data on taxonomic names and publications from the Australian Faunal Directory (AFD). This has been enhanced by adding lots of digital identifiers (such as DOIs) to the publications and, where possible, full text either as PDFs or as page scans from the Biodiversity Heritage Library (BHL) (provided via BioStor). Identifiers enable us to further grow the knowledge graph, for example by adding "cites" and "cited by" links between publications (data from CrossRef), and displaying figures from the Biodiversity Literature Repository (BLR).
The demo is here: https://ozymandias-demo.herokuapp.com/ If you’re looking for starting points, you could try:
Assassin spiders (images from Plazi and citation data from CrossRef) https://ozymandias-demo.herokuapp.com/?uri=https://biodiversity.org.au/afd/publication/64908f75-456b-4da8-a82b-c569b4806c22
Memoirs of Museum Victoria (dynamic query finds record in Wikidata and adds map) https://ozymandias-demo.herokuapp.com/?uri=https://biodiversity.org.au/afd/publication/5c22a8d1-7456-4f8c-9384-1246ecbf15a6
G. R. Allen (we can from the taxonomic tree of his top 20 taxa that he studies fish - who knew?) https://ozymandias-demo.herokuapp.com/?uri=https://biodiversity.org.au/afd/publication/%23creator/g-r-allen
Paper on mosquito taxonomy with lots of citations, including material in BHL/BioStor https://ozymandias-demo.herokuapp.com/?uri=https://biodiversity.org.au/afd/publication/578d1dec-5816-49ec-8916-3f957fd230f5
Paper on Australian flies with full text in BioStor https://ozymandias-demo.herokuapp.com/?uri=https://biodiversity.org.au/afd/publication/0ffe4f28-b8ac-4132-be34-19eb03fbf685
The focus for now is on taxa, publications, journals, and people. Occurrences and sequences are on the “to do” list. As always there’s lots of data cleaning and cross linking to do, but an obvious next step is to link people’s names to identifiers such as ORCID and Wikidata ids, so that we can trace the activities of taxonomists as they discover and describe Australian biodiversity (the choice of Australia is simply to keep things manageable, and because the amount of data and digitisation they’ve done is pretty extraordinary). I’m also working to a deadline as I'm trying to get this demo wrapped up in the next couple of weeks.
Technical details
TL;DR the knowledge graph is implemented as a triple store where the data has been represented using a small number of vocabularies (mostly schema.org with some terms borrowed from TAXREF-LD and the TDWG LSID vocabularies). All results displayed in the first two panels are the result of SPARQL queries, the content in the rightmost panel comes from calls to external APIs. Search is implemented using Elasticsearch. If you are feeling brave you can query the knowledge graph directly in SPARQL. I’m constantly tweaking things and adding data and identifiers, so things are likely to break. More details and documentation will be going up on the GitHub repository.Friday, July 20, 2018
Signals from Singapore: NGS barcoding, generous interfaces, the return of faunas, and taxonomic burden
Earlier this year I stopped over in Singapore, home of the spectacular "supertrees" in the Garden by the Bay. The trip was a holiday, but I spent a good part of one day visiting Rudolf Meier's group at the National University of Singapore. Chatting with Rudolf was great fun, he's opinionated and not afraid to share those opinions with anyone who will listen. Belatedly I've finally written up some of the topics we discussed.
Massively scalable and cheap DNA barcoding
Singapore has a rich fauna in a small area, full of undescribed species, so DNA barcoding seems an obvious way to get a handle on its biodiversity. Rudolf has been working towards scalable and cheap barcoding, e.g. $1 DNA barcodes for reconstructing complex phenomes and finding rare species in specimen‐rich samples https://doi.org/10.1111/cla.12115 . His lab can sequence short (~300 bp) barcode sequences for around $US 0.50 per specimen. Their pipeline generates lots of data, accompanied by high quality photographs of exemplar specimens, which contribute to The Biodiversity of Singapore, a "Digital Reference Collection for Singapore's Biodiversity". This site provides a simple but visually striking way to explore Singapore's biota, and is a nice example of what Mitchell Whitelaw calls "generous interfaces". We could do with more of these for biodiversity data.
One nice feature of regular COI DNA barcodes is that they are comparable across labs because everyone is sequencing the same stretch of DNA. With short barcodes, different groups may target different regions of the COI gene, resulting in sequences that can't be compared. For example, the 127bp mini barcodes developed in A universal DNA mini-barcode for biodiversity analysis https://doi.org/10.1186/1471-2164-9-214 are completely disjoint from the ~300bp sequenced by Meier's group (I'm trying to keep track of some of these short barcodes here: https://gist.github.com/rdmpage/4f2545eeea4756565925fb4307d9af6b.
The return of regional faunas
In the "old days" of colonial expansion it was common for taxonomists to write volume entitled "The Fauna of [insert colonised country here]". These were regional works focussing on a particular area, often motivated by trying to catalogue animals of potential economic or medical importance, as well as of scientific interest. By limiting their geographic scope, faunal treatments of taxa can sometimes be inadequate. Descriptions of new species from a particular area may be hard to compare with descriptions of species in the same group that occur elsewhere and are described by other taxonomists. It may be that to do the taxonomy of a particular group well you need to treat that group throughout its geographic range, rather then just those species in your geographic area. Hence faunas loose their scientific appeal, despite the attractiveness of having a detailed summary of the fauna of a particular area. DNA sequencing circumvents this problem by having a universally comparable character. You can sequence everything within a geographic region, but those sequences will be directly comparable to sequences found elsewhere. Barcoding makes faunas attractive again, which may help funding taxonomic research because it makes funding projects with a restricted national scope scientifically still worthwhile.Taxonomic burden and legacy names
As we discover and catalogue more and more of the planet's biodiversity we want to stick names on that biodiversity, and this can be a significant challenge when there is a taxonomic legacy of names that are so poorly described it is hard to establish how they relate to the material we are working with. Even if you have access to the primary literature through digitisation projects like BHL, if the descriptions are poor, if the types are lost or their identity is confused (see for example A New Species of Megaselia Rondani (Diptera: Phoridae) from the Bioscan Project in Los Angeles, California, with Clarification of Confused Type Series for Two Other Species https://doi.org/10.4289/0013-8797.118.1.93 by Emily A. Hartop - who I met on this trip - and colleagues), or can't be sequenced, then these names will remain ambiguous, and potentially clogging up efforts to name the unnamed species. One approach favoured by Rudolf is to effectively wipe the slate clean, declare all ambiguous names before a certain date to be null and void, and start again. This renders (or rather, resets) the notion of priority - given two names for the same species the older name is the one to use - and so is likely to be a hard sell, but it is part of the ongoing discussion about the impact of molecular data on naming taxa. Similar discussions are raging at the moment in mycology, e.g. Ten reasons why a sequence-based nomenclature is not useful for fungi anytime soon https://doi.org/10.5598/imafungus.2018.09.01.11, yet a another reflection of how much taxonomy is driven by technology.Thursday, July 05, 2018
GBIF at 1 billion - what's next?
GBIF has reached 1 billion occurrences which is, of course, something to celebrate:
#GBIF1billion has arrived! Merci beaucoup, @Le_Museum @INPN_MNHN et @gbiffrance!
— GBIF (@GBIF) July 4, 2018
Thanks and congratulations, too, to the 1,217 data publishers and 92 participants who make the GBIF network go! More details to follow Thursday (champagne doesn't drink itself)… pic.twitter.com/xQ2f5fIt2x
An achievement on this scale represents a lot of work by many people over many years, years spent developing simple standards for sharing data, agreeing that sharing is a good thing in the first place, tools to enable sharing, and a place to aggregate all that shared data (GBIF).
So, I asked a question:
So I guess the real #GBIF1billion question is what can we do with a billion data points that we couldn't do with, say, a hundred million? Does more data simply mean more of same kind of analyses, or does it enable something new (and exciting)? @GBIF
— Roderic Page (@rdmpage) July 4, 2018
My point is not to do this:
Hey, don't spoil the party!
— Dimitri Brosens (@Dimibro) July 4, 2018
Rather it is to encourage a discussion about what happens when we have large amounts of biodiversity data. Is it the case that as we add data we simply enable more of the same kind of science, only better (e.g., more data for species distribution modelling), or do we reach a point where new things become possible?
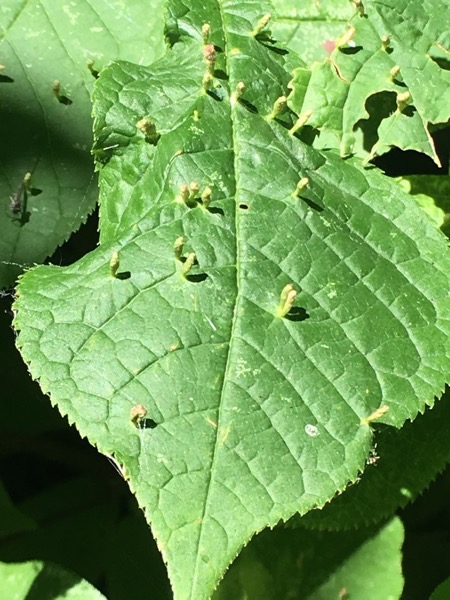
To give a concrete example, consider iNaturalist. This started out as a Masters project to collect photos of organisms on Flickr. As you add more images you get better coverage of biodiversity, but you still have essentially a bunch of pictures. But once you have LOTS of pictures, and those are labelled with species names, you reach the point where it is possible to do something much more exciting - automatic species identification. To illustrate, I recently took the photos below:
Note the reddish tubular growths on the leaves. I asked iNaturalist to identify these photos and within a few seconds it came back with Eriophyes tiliae, the Red Nail Gall Mite. This feels like magic. It doesn't rely on complicated analysis of the image (as many earlier efforts at automated identification have done) it simply "knows" that images that look like this are typically of the galls of this mite because it has seen many such images before. (Another example of the impact of big data is Google Translate, initially based on parsing lots of examples of the same text in multiple languages.)
Okay, but then not sure I see what you're looking for. Why would 1 billion, as opposed to, say, 100 million, mean a paradigm shift? Do you have any (even hypothetical) answers to suggest yourself?
— Leif Schulman (@Leif_Sch) July 5, 2018
The "1 billion" number is not, by itself, meaningful. It's rather that I hope that while we're popping the champagne and celebrating a welcome, if somewhat arbitrary milestone, I'm hoping that someone, somewhere is thinking about whether biodiversity data on this scale enables something new.
Do I have answers? Not really, but here's one fairly small-scale example. One of the big challenges facing GBIF is getting georeferenced data. We spend a lot of time using a variety of tools and databases to convert text descriptions one collection localities into latitude and longitude. Many of these descriptions include phrases such as "5 mi NW of" and so we've developed parsers to attempt to make sense of these. All of these phrases and the corresponding latitude and longitude coordinates have ended up in GBIF. Now, this raises the possibility that after a point, pretty much any locality phrase will be in GBIF, so a way to georeference a locality is simply to search GBIF for that locality and use the associated latitude and longitude. GBIF itself becomes the single best tool to georeference specimen data. To explore this idea I've built a simple tool on glitch https://lyrical-money.glitch.me that takes a locality description and geocodes it using GBIF.
You paste in a locality string and it attempt to find that on a map based on data in GBIF. This could be automated, so you could imagine being able to georeference whole collections as part of the process of uploading the data to GBIF. Yes, the devil is in the details, and we'd need ways to flag errors or doubtful records, but the scale of GBIF starts of open up possibilities like this.
So, my question is, "what's next?".