Wednesday, April 16, 2014

Breaking the Biodiversity Heritage Library

The Biodiversity Heritage Library (BHL) has recently introduced a feature that I strongly dislike. The post describing this feature (Inspiring discovery through free access to biodiversity knowledge... states:

Now BHL is expanding the data model for its portal to be able to accommodate references to content in other well-known repositories. This is highly beneficial to end users as it allows them to search for articles, alongside books and journals, within a single search interface instead of having to search each of these siloes separately.

What this means is that, whereas in the past a search in BHL would only turn up content actually in BHL, now that search may return results from other sources. What's not to like? Well, for me this breaks the fundamental BHL experience that I've come to rely on, namely:

If I find something in BHL I can read it there and then

With the new feature, the search results may include links to other sources. Sometimes these are useful, but sometimes they are anything but. Once you start including external links in your search results, you have limited control over what those links point to. For example, if I search BHL for the journal Revista Chilena de Historia Natural I get two hits. Cool! So I click on one hit and I can read a fairly limited set of scanned volumes in BHL, if I click on the other hit I'm taken to a page at the Digital Library of the Real Jardín Botánico of Madrid. This is a great resource, but the experience is a little jarring. Worse, for this journal the Real Jardín Botánico doesn't actually have any content, instead the "View Book" link takes me to SciElo in Chile, where I can see a list of recent volumes of this journal.

In this case, BHL is basically a link farm that doesn't give me direct access to content, but instead sends me on a series of hops around the Internet until I find something (and I could have gotten there more quickly via Google).

What is wrong with this?


There are two reasons I dislike what BHL have done. The first is that it breaks the experience of search then read within a consistent user interface. Now I am presented with different reading experiences, or, indeed, no reading at all, just links to where I might find something to read.

More subtlety, it undermines a nice feature of BHL, namely searching by taxonomic names. The content BHL has scanned has also been indexed by taxonomic name, so often I find what I'm looking for not by using bibliographic details (journal name, volume, etc.), which are often a bit messy, but by searching on a name. External content has not been indexed by name, so it can't be found in this way. Whereas before, if I search by name I would be reasonably confident that if BHL had something on that name I could find it (barring OCR errors), now BHL may well have what I looking for (in an external source) but can't show me that because it hasn't been indexed.

From my perpsective, the things I've come to rely on have been broken by this new feature (and I haven't even begun to talk about how this breaks things I rely on to harvest BHL for article metadata, which I then put into BioStor, which in turn gets fed back into BHL).

What should BHL have done?


To be clear, I'm not arguing against BHL being "able to accommodate references to content in other well-known repositories". Indeed, I'd wish they'd go further and incorporate content from BHL-Europe, whose portal is, frankly, a mess. Rather, my argument is that they should not have done this within the existing BHL portal. Doing so dilutes the fundamental experience of that portal ("if I find it I can read it").

Here's what I would do instead:
  1. Keep the current BHL portal as it was, with only content actually scanned and indexed by BHL.
  2. Create a new site that indexes all relevant content (e.g., BHL, BHL-Europe, and other repositories.
  3. Model this new portal on something like CrossRef's wonderful metadata search. That is, throw all the metadata into a NoSQL database, add a decent search engine, and provide users with a simple, fast tool.
  4. The portal should clearly distinguish hits that are to BHL content (e.g. by showing thumbnails) and hits that are to external links (and please filter links to links!).
  5. Add taxonomic names to the index (you have these for BHL content, adding them for external content is pretty easy).
  6. Even more useful, start indexing full text content, maybe starting at articles ("parts"). At the moment Google is doing a better job of indexing BHL content (indirectly via indexing Internet Archive) than BHL does.

Creating a new tool would also give BHL the freedom to explore some new approaches without annoying users like me who have come to rely on the currently portal working in a certain way. Otherwise BHL risks "feature creep", however well motivated.

Thursday, April 10, 2014

User interface to edit a point location

Circle
Following on from earlier posts on annotating biodiversity data (Rethinking annotating biodiversity data and More on annotating biodiversity data: beyond sticky notes and wikis) I've started playing with user interfaces for editing data.

For example, here's a simple interface to edit the location of a specimen or observation (inspired by the iNaturalist observation editor). You can play with this below or on on bl.ocks.org, and the source code is on GitHub https://gist.github.com/rdmpage/9951904.


Tuesday, April 08, 2014

The Experimenter’s Museum: GenBank, Natural History, and the Moral Economies of Biomedicine

An undergraduate student (Aime Rankin) doing a project with me on citation and impact of museum collections came across a paper I hadn't seen before:
Strasser, B. J. (2011, March). The Experimenter’s Museum: GenBank, Natural History, and the Moral Economies of Biomedicine. Isis. University of Chicago Press. doi:10.1086/658657


Unfortunately the paper is behind a paywall, but here's the abstract (you can also get a PDF here):

Today, the production of knowledge in the experimental life sciences relies crucially on the use of biological data collections, such as DNA sequence databases. These collections, in both their creation and their current use, are embedded in the experimentalist tradition. At the same time, however, they exemplify the natural historical tradition, based on collecting and comparing natural facts. This essay focuses on the issues attending the establishment in 1982 of GenBank, the largest and most frequently accessed collection of experimental knowledge in the world. The debates leading to its creation—about the collection and distribution of data, the attribution of credit and authorship, and the proprietary nature of knowledge—illuminate the different moral economies at work in the life sciences in the late twentieth century. They offer perspective on the recent rise of public access publishing and data sharing in science. More broadly, this essay challenges the big picture according to which the rise of experimentalism led to the decline of natural history in the twentieth century. It argues that both traditions have been articulated into a new way of producing knowledge that has become a key practice in science at the beginning of the twenty-first century.

It's well worth a read. It argues that sequence databases such as Genbank are essentially the equivalent of the great natural history museums of the 19th Century. There are several ironies here. One is that some early advocates of molecular biology cast it as a modern, experimental science as opposed to mere natural history. However, once the amount of molecular data became too great for individuals to easily manage, and once it became clear that many of the questions being asked required a comparative approach, the need for a centralised database of sequences (the "experimenter's museum" of the title of the paper) became increasingly urgent. Another irony is that the clash between molecular and morphological taxonomy overlooks these striking similarities in history (collecting ever increasing amounts of data eventually requiring centralisation).

Bruno Strasser's article also discusses the politics behind setting up GenBank, including the inevitable challenge of securing funding, and the concerns of many individual scientists about the loss of control over their data. A final irony is that, having gone through this process once with the formation of the big museums in the 19th century, we are going through it again with the wrangling over aggregating the digitised versions of the content of those museums.

Update: See also
Strasser, B. J. (2008, October 24). GENETICS: GenBank--Natural History in the 21st Century? Science. American Association for the Advancement of Science (AAAS). doi:10.1126/science.1163399
(via Guanyang Zhang).

Friday, April 04, 2014

More on annotating biodiversity data: beyond sticky notes and wikis

Following on from the previous post Rethinking annotating biodiversity data, here are some more thoughts on annotating biodiversity data.

Annotations as sticky notes


I get the sense that most people think of annotations as "sticky notes" that someone puts on data. In other words, the data is owned by somebody, and anyone who isn't the owner gets to make comments, which the owner is free to use or ignore as they see fit. With this model, the focus is on how the owner deals with the annotations, and how they manage the fact that their data may have changed since the annotations were made.

This model has limitations. For a start, it privileges the "owner", and puts annotators at their mercy. For example, I posted an issue regarding a record in the Museum of Comparative Zoology Herpetology database (see https://github.com/mcz-vertnet/mcz-subset-for-vertnet/issues/1). VertNet has adopted GitHub to manage annotations of collection data, which is nice, but it only works if there's someone at the other end ready to engage with people like me who are making annotations. I suspect this is mostly not going to be the case, so why would I bother annotating the data? Yes, I know that VertNet has only just set this up, but that's missing the point. Supporting this model requires customer support, and who has the resources for that? If I don't get the sense that someone is going to deal with my annotation, why bother?

So, the issues here are that the owner gets all the rights, the annotators have none, and in practice the owners might not be in a position to make use of the annotations anyway.

Wikis


OK, if the owner/annotator model doesn't seem attractive, what about wikis? Let's put the data on a wiki and let folks edit it, that'll work, right? There's a lot to be said in favour of wikis, but there's a disadvantage to the basic wiki model. On a wiki, there is one page for an item, and everyone gets to edit that same page. The hope is that a consensus will emerge, but if it doesn't then you get edit wars (e.g., When taxonomists wage war in Wikipedia). If you've made an edit, or put your data on a wiki, anyone can overwrite it. Sure, you can roll back to an earlier version, but so can anyone else.

Wikis bring tools for community editing, but overturn ownership completely, so the data owner, or indeed any individual annotator has no control over what happens to their contributions. Why would an expert contribute if someone else can undo all their hard work?

Social data


So, if sticky notes and wikis aren't the solution, what is? I've been looking at Fluidinfo lately. There's an interview here, and a book here. The company has gone quiet lately (apparently focussing on enterprise customers), but what matters here is the underlying idea, namely "social data".

Fluidinfo's model is that it is a database of objects (representing things or concepts), and anyone can add data to those objects (they are "openly writable"). The key is that every tag is linked to the user, and by default you can only add, edit, or delete your own tags. This means that if a data provider adds, say a bibliographic reference to the database, I can edit it by adding tags, but I can't edit the data provider's tags. To make this a bit more concrete, suppose we have a record for the article with the DOI 10.1163/187631293X00262. We can represent the metadata from CrossRef like this:

{
"_id": "10.1163/187631293X00262",
"crossref/doi" : "10.1163/187631293X00262",
"crossref/title" : "A taxonomic review of the pondskater...",
"crossref/journal" : "Insect Systematics & Evolution",
"crossref/issn" : [ "1399-560X", "1876-312X"]
}

Note the use of the namespace "crossref" in the tags. This is data that, notionally, CrossRef "owns" and can edit, and nobody else. Now, as I've discussed earlier (Orwellian metadata: making journals disappear) some publishers have an annoying habit of retrospectively renaming journals. This article was published in Entomologica Scandinavica, which has since been renamed Insect Systematics & Evolution, and CrossRef gives the latter as the journal name for this article. But most citations to the article will use the old journal name. Under the social data model, I can add this information (in bold):

{
"_id": "10.1163/187631293X00262",
"crossref/doi" : "10.1163/187631293X00262",
"crossref/title" : "A taxonomic review of the pondskater...",
"crossref/journal" : "Insect Systematics & Evolution",
"crossref/issn" : ["1399-560X", "1876-312X"],
"rdmpage/journal" : "Entomologica Scandinavica","rdmpage/issn" : ["0013-8711" ]
}

My tags have the namespace "rdmpage", so they are "mine". I haven't overwritten the "crossref" tags. Somebody else could add their own tags, and of course, CrossRef could update their tags if they wish. We can all edit this object, we don't need permission to do so, and we can rest assured that our own edits won't be overwritten by somebody else.

This model can be quite liberating. If you are a data provider/owner, you don't have to worry about people trampling over your data, because you (and any users of your data) can simply ignore tags not in your namespace ("ignore those rdmpage' tags, that Rod Page chap is clearly a nutter"). Annotators are freed from their reliance on data providers doing anything with the annotations they created. I don't care whether CrossRef decides to revert the journal name Insect Systematics & Evolution to Entomologica Scandinavica for earlier article (or not), I can just use the "rdmpage/journal" (if it exists) to get what I think is the appropriate journal name. My annotations are immediately usable. Because everyone gets to edit in their own namespace, we don't need to form a consensus, so we don't need the version control feature of wikis to enable roll backs, there are no more edit wars (almost).

Implementation


A key feature of the Fluidinfo social data model is that the data is stored in a single, globally accessible place. Hence we need a global annotation store. Fluidinfo itself doesn't seem to have a publicly accessible database, I guess in part because managing one is a major undertaking (think Freebase). Despite Nicholas Tollervey's post (FluidDB is not CouchDB (and FluidDB's secret sauce)), I think CouchDB is exactly the way I'd want to implement this (it's here, it works, and it scales). The "secret sauce" is essentially application logic (every key has a namespace corresponding to a given user).

The more I think about this model the more I like it. It could greatly simplify the task of annotating biodiversity data, and avoid what I fear are going to be the twin dead ends of sticky note annotation and wikis.

Monday, March 31, 2014

Rethinking annotating biodiversity data

TL;DR By using bookmarklets and a central annotation store, we can build a system to annotate any biodiversity database, and display those annotations on those databases.

A couple of weeks ago I was at GBIF meeting in Copenhagen, and there was a discussion about adding a new feature to the GBIF portal. The conversation went something like this:

Advisor: "We really need this feature, now!"

Developer: "OK, but which of these other things you've told us we need to do should we stop doing, so we can add this new feature?"

Resources are limited, and adding new features to a project can be difficult. This got me thinking about the issue of annotating data, in GBIF and other biodiversity projects. There have been a number of recent papers on annotating biodiversity data, such as:

Morris, R. A., Dou, L., Hanken, J., Kelly, M., Lowery, D. B., Ludäscher, B., Macklin, J. A., et al. (2013, November 4). Semantic Annotation of Mutable Data. (I. N. Sarkar, Ed.)PLoS ONE. Public Library of Science (PLoS). doi:10.1371/journal.pone.0076093
Tschöpe, O., Macklin, J. A., Morris, R. A., Suhrbier, L., & Berendsohn, W. G. (2013, December 20). Annotating biodiversity data via the Internet. Taxon. International Association for Plant Taxonomy (IAPT). doi:10.12705/626.4

It seems to me that these potentially suffer the assumption that data aggregators such as GBIF, and data providers such as natural history collections have sufficient resources in place to (a) implement such systems, and (b) process the annotations made by the community and update their records. What if neither assumption holds true?

Everyone is busy


Any system which requires a project to add another feature is going to have to compete with other priorities. I ran into this with my BioNames project, which was partly funded by EOL. BioNames links taxonomic names for animals (obtained from ION) to the primary literature, for example Pinnotheres atrinicola was published in the following paper:

Page, R. D. M. (1983). Description of a new species of Pinnotheres , and redescription of P. novaezelandiae (Brachyura: Pinnotheridae) . New Zealand Journal of Zoology, 10(2), 151–162. doi:10.1080/03014223.1983.10423904.

Ideally, all the links between names and publications that I'd assembled in BioNames would have been added to EOL, so that (wherever possible) users of EOL could see the original description of a taxon in EOL. But this didn't happen. In order to get BioNames into EOL I had to export the data in Darwin Core format, which is poorly suited to this kind of data. It also became clear that BioNames and EOL had rather different data models when it came to taxa, names, and publications. This meant it was going to be challenge providing the data in w ay that was usable by EOL. Plus, EOL was pretty busy doing other things such as developing TraitBank™ (yes, that's a "™" after TraitBank). So, I never did get BioNames content into EOL.

But there's another way to do this.

The Web means never having to ask for permission


It occurred to me (around about the time that I was at the pro-iBiosphere hackathon at Leiden) that there's another way to tackle this, a way which uses bookmarklets. Bookmarklets are little snippets of Javascript that can be stored as bookmarks in your web browser, and they can add extra functionality to an existing web page. You may well have come across these already, such as Save to Mendeley , or Altmetric it.

How does this help us with annotation? Well, with a little programming, you can add features that you think are "missing" from a web page, and you don't need to ask anyone's permission to do it. So, I could negotiate with EOL about how to get data from BioNames into EOL, or I can simply do this:

2014 03 31 17 05 26

What I've done here is create a bookmarklet that recognises that you are looking at an EOL page, it then calls the BioNames API and displays the original publication of the taxon displayed on the page (in this case, Pinnotheres atrincola). So, I've added the information from BioNames to the EOL page, without needing EOL to do anything.

But it gets better. We can do this with pretty much any web page. The example above displays the original publication of a taxon name, but imagine we are looking at the publisher's page for that article (you can see it here: http://dx.doi.org/10.1080/03014223.1983.10423904). Wouldn't it be nice if the publisher knew that this paper described a new species of crab? We could negotiate with the publisher about how to give them that information, and how they could display it, or we can just add it:

2014 03 31 17 15 08

This time the bookmarklet recognises that the web page has a DOI, then asks BioNames whether there have been any names published in the paper with that DOI, if it finds any they are displayed in the popup.

Bookmarklets enable you to enhance a web page with any information you like. This makes them ideal for displaying annotations on a page. If you want to try yourself, you can grab the bookmarklet from here.

Making annotations visible


Bookmarklets can be used to solve one part of the annotation problem, namely showing existing annotations. I have lots of exmaples of errors in datasets, I blog about some of these, I store some in Evernote for future reference, some end up in unfinished manuscripts, and so on. The problem is that these annotations are of little use to anyone else because if you go to GBIF you don't see my annotations (or, indeed, anyone else's). But we can use a bookmarklet to display these, without having to pester GBIF themselves to add this feature! Imagine a bookmarklet that you could click on and it shows you whether anyone as queried the identification of a specimen, or the location of a specimen?

Where do the annotations come from?


Of course, all this presupposes that we have annotations to start with. I think there are at least two classes of annotations. The first, most obvious annotations are ones that change or add attributes to an object. For example, adding latitude and longitude coordinates to a specimen. These are annotations we would want to display just on the corresponding page in the source database (e.g., displaying a map in the annotation popup on GBIF for a record we've georeferenced).

The second class comprise cross-links between data sets. For example, linking a species in EOL to DOI of the publication that first described that species. Or linking a specimen in GBIF to the sequences in GenBank that were obtained from that specimen. These annotations are different in that we might want to display them on multiple web pages (e.g., pages served by both a biodiversity database and an academic publisher). From this perspective, a database like BioNames is essentially a big store of annotations.

But we need more than this, we need to be able to annotate any class of data that is relevant to biodiversity. We need to be able to edit erroneous GBIF records, flag Genbank sequences that have been misidentified, document taxonomic names that are entirely spurious, and so on. And we need to make these annotations available via APIs so that anywone can access them. To me, it seems obvious that we need a single, centralised annotation store.

A global annotation store


One way to implement an annotation store would be to create a wiki-style database that the community could edit. This database gets populated with data that can then be edited, refined, and discussed. For example, imagine a GBIF user spots an occurrence that is clearly wrong (a frog in the middle of the ocean). They could have a bookmarklet that they click on, and it displays any existing annotations of that record. If there aren't any, let's imagine there is a link to the annotaion store. Clicking on that creates a record for that occurrence, and the user then edits that. Perhaps they discover that the latitude and longitudes have been swapped, so they swap them back, and save the record. The next person to go to that page in GBIF clicks on their bookmarklet and discoveres that there is a potential issue with that record (the popup displayed by the bookmarklet will have a "warning symbol", and an updated map).

Some annotations will be simple, some may require some analysis. For example, a claim that a GenBank sequence has been misidentified would be stronger if it was backed up by a BLAST analysis that demonstrated that the sequence was clustered with taxa that you would not expect based on its putitative identification.

We can also annotate in bulk, and upload these annotations directly to the annotation store. For example, we could map GBIF taxa to taxonomic name identifiers from nomenclators such as ION, ZooBank, IPNI, Index Fungorum, etc., then map those identifiers to the primary litertaure, and upload all of that data to the annotation store, making them available to anyone visiting GBIF (or, indeed, the nomenclators). We could BLAST DNA barcode sequences and suggest potential identifications. We could add lists of publications that cite museum specimen codes, and display those on the GBIF page that corresponds to each code. There is almost no limit to the richness of annotations we could add to existing webpages.

Filtered push


One aspect of annotation that I've glossed over is how the annotations get back to the primary data providers. There has been some work on this (see papers cited at the start), but in a sense I don't think this is the most pressing problem (in part because I suspect most providers are in no position to undertake the kind of data editing and cleaning required). My concern is at the other end of the process. Users of biodiversity data are frequently presented with data that is demonstrably erroneous, and it inconveniences them, as well as hurting the reputation of aggregators such as GBIF, or databases such as GenBank. Anyone doing an analysis of these sorts of data will spend some time cleaning and correcting the data, we desperately need mechanisms to capture these annotations and make them available to other users. The extent to which these annotations filter back to the primary data providers is, in my view, a less pressing issue.

That said, a central annotation store would have lots of advantages for primary providers. It's one place to go to get annotations. The fate of a user's edits could help develop metrics of reliability of annotations, and so on.

Summary


The reason I find this approach attractive is that it frees us from having to wait for projects like GBIF and GenBank to support annotations. We don't need to wait, we can simply do it ourselves right now. We can add overlays that augment existing data (e.g., adding original publications to EOL web pages), or flag errors. Take the example bookmarklet from here for a spin and see what it can do. It's very crude, but I think it gives an indication of the potential of this approach.

So, "all" we need is a centralised, editable, database of annotations that we can hook the bookmarklet into. Simples.

Thursday, March 13, 2014

Publishing biodiversity data directly from GitHub to GBIF

GoogleEarth Image
Today I managed to publish some data from a GitHub repository directly to GBIF. Within a few minutes (and with Tim Robertson on hand via Skype to debug a few glitches) the data was automatically indexed by GBIF and its maps updated. You can see the data I uploaded here.

The data I uploaded came from this paper:

Shapiro, L. H., Strazanac, J. S., & Roderick, G. K. (2006, October). Molecular phylogeny of Banza (Orthoptera: Tettigoniidae), the endemic katydids of the Hawaiian Archipelago. Molecular Phylogenetics and Evolution. Elsevier BV. doi:10.1016/j.ympev.2006.04.006
This is the data I used to build the geophylogeny for Banza using Google Earth. Prior to uploading this data, GBIF had no georeferenced localities for these katydids, now it has 21 occurrences:

DatasetHow it works

I give details of how I did this in the GitHub repository for the data. In brief, I took data from the appendix in the Shapiro et al. paper and created a Darwin Core Archive in a repository in GitHub. Mostly this involved messing with Excel to format the data. I used GBIF's registry API to create a dataset record, pointed it at the GitHub repository, and let GBIF do the rest. There were a few little hiccups, such as needing to tweak the meta.xml file that describes the data, and GBIF's assumption that specimens are identified by the infamous "Darwin Core Triplet" meant I had to invent one for each occurrence, but other than that it was pretty straightforward.

I've talked about using GitHub to help clean up Darwin Core Archives from GBIF, and VertNet are using GitHub as an issue tracker, but what I've done here differs in one crucial way. I'm not just grabbing a file from GBIF and showing that it is broken (with no way to get those fixes to GBIF), nor am I posting bug reports for data hosted elsewhere and hoping that someone will fix it (like VertNet), what I'm doing here is putting data on GitHub and having GBIF harvest that data directly from GitHub. This means I can edit the data, rebuild the Darwin Core Archive file, push it to GitHub, and GBIF will reindex it and update the data on the GBIF portal.

Beyond nodes

GBIF's default publishing model is a federated one. Data providers in countries (such as museums and herbaria) digitise their data and make it available to national aggregators ("nodes"), which typically host a portal with information about the biodiversity of that nation (the Atlas of Living Australia is perhaps the most impressive example). These nodes then make the data available to GBIF, which provides a global portal to the world's biodiversity data (as opposed to national-level access provided by nodes).

This works well if you assume that most biodiversity data is held by national natural history collections, but this is debatable. There are other projects, some of them large and not necessarily "national" that have valuable data. These projects can join GBIF and publish their data. But what about all the data that is held in other databases (perhaps not conventionally thought of as biodiversity databases), or the huge amount of information in the published literature. How does that get into GBIF? People like me who data mine the literature for information on specimens and localities, such as this map of localities mentioned in articles in BioStor. How do we get that data into GBIF?

BiostorData publishing

Being able to publish data directly to GBIF makes putting the effort into publishing data seem less onerous, because I can see it appear in GBIF within minutes. Putting 21 records of katydids is clearly a drop in the ocean, but there is potentially vastly more data waiting to be mined. managing the data on GitHub also makes the whole process of data cleaning and edit transparent. As ever, there are a couple of things that still need to be tackled.

It's who you know

I've been able to do this because I have links with GBIF, and they have made the (hopefully reasonable) assumption that I'm not going to publish just any old crap to GBIF. I still had to get "endorsed" by the UK node (being the chair of the GBIF Science Committee probably helped), and I'm lucky that Tim Roberston was online at the time and guided me through the process. None of this is terribly scalable. It would be nice if we had a way to open up GBIF to direct publishing, but also with a review process built in (even if it's a post-review so that data may have to be pulled if it becomes clear it's problematic). Perhaps this could be managed via GitHub, for example data could be uploaded and managed there, and GBIF can then choose to pull that repository and the data would appear on GBIF. Another model is something like the Biodiversity Data Journal, but that doesn't (as far as I know) have a direct feed into GBIF.

Whichever approach we take, we need a simple, frictionless way to get data into GBIF, especially if we want to tackle the obvious geographic and taxonomic biases in the data GBIF currently has.

DOIs please

It would be great if I could get a DOI for this data set. I had toyed with putting it on Figshare which would give me a DOI, but that just puts an additional layer between GitHub and GBIF. Ideally instead (or as well as) the UUID I get from GBIF to identify the dataset, I'd get a DOI that others can cite, and which would appear on my ORCID profile. I'd also want a way to link the data DOI to the DOI for the source paper (doi:10.1016/j.ympev.2006.04.006), so that citations of the data can pass some of that "link love" to the original authors. So, GBIF needs to mint DOIs for datasets.

Summary

The ability to upload data to GitHub and then have that harvested by GBIF is really exciting. We get great tools for managing changes in data, with a simple publication process (OK, simple if you know Tim, and can speak REST to the GBIF API). But we are getting closer to easy publishing and, just as importantly, easy editing and correcting data.


Monday, March 10, 2014

Displaying a million DNA barcodes on Google Maps using CouchDB

BarcodeFollowing on from the previous post on putting GBIF data onto Google Maps, I'm now going to put DNA barcodes onto Google Maps. You can see the result at http://iphylo.org/~rpage/bold-map/, which displays around 1.2 million barcodes obtained from the International Barcode of Life Project (iBOL) releases. Let me describe how I made it.

Tiles


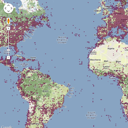
Typically when people put markers on a Google Map it is done in Javascript using the Google Maps API, and all the work is done by the browser. This works well if you haven't got too many points, but once you have more than, say, a few hundred, the browser struggles to cope. Hence, for something like GBIF or DNA barcodes where we have millions of records we need a different approach. In the GBIF data example I discussed previously I used tiles supplied by GBIF. Tiles are the basis of the "slippy maps" used by Google and others to create the experience of beig able to zoom in and out at any point on the map. At any time, the map you see in the web browser is made up of a small number of images ("tiles") that are typically 256 × 256 pixels in size. At the lowest zoom level (0) the world is represented by a single tile:

WorldTile
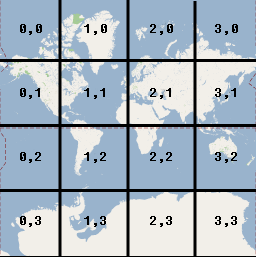
If you zoom in to the next level (1), the world now covers 41=4 tiles, zoom in again and the world now covers 42 = 16 tiles, and so on.

TileCoordinates
At each zoom level the tiles cover a smaller part of the world, and have increasing detail, so the user has the experience of zooming in closer and closer to an ever larger and more detailed map. But the browser only ever has to display enough 256 × 256 pixel tiles to fill the browser window.

Not only can we have tiles for the map of the world, we can also have tiles for data that we want to display on that map. For example, GBIF can create tiles for the hundreds of millions of occurrences in its database, so what looks like a giant map of millions of records is actually just a set of 256 x 256 tiles coloured to represent the number of records at each position on the tile.

DNA Barcodes


I wanted to make a map for DNA barcodes, but unfortunately there aren't any tiles I can use to create the map. So, I set about making my own. Here's what I did. Firstly, I downloaded the DNA barcode data from the BOLD site, and put the barcodes into a CouchDB database hosted by Cloudant. I simply parsed the tab-delimited data files and created a JSON document for each barcode, and stored that in CouchDB.

I then created a view in CouchDB that generated data for each tile. Each zoom level has its own tiles (for zoom level n there are 4n tiles). There's a nice web page on the Open Street Map wiki that describes how to compute slippy map tilenames. Here's the code I use to generate the CouchDB view:


function(doc) {
var tile_size = 256;
var pixels = 4;

if (doc.lat && doc.lon) {

for (var zoom = 0; zoom < 7; zoom++) {

var x_pos = (parseFloat(doc.lon) + 180)/360
* Math.pow(2, zoom);
var x = Math.floor(x_pos);

var relative_x = Math.round(tile_size * (x_pos - x));

var y_pos = (1-Math.log(Math.tan(parseFloat (doc.lat)
* Math.PI/180) + 1/Math.cos(parseFloat(doc.lat)
* Math.PI/180))/Math.PI)/2
* Math.pow(2,zoom);
var y = Math.floor(y_pos);
var relative_y = Math.round(tile_size * (y_pos - y));

relative_x = Math.floor(relative_x / pixels) * pixels;
    relative_y = Math.floor(relative_y / pixels) * pixels;

var tile = [];
tile.push(zoom);
tile.push(x);
tile.push(y);
tile.push(relative_x);
tile.push(relative_y);

emit(tile, 1);
}
}
}

For each zoom level that I support (0 to 6) I convert the latitude and longitude of the DNA barcode sample into the coordinates of the corresponding 256 × 256 tile. I then compute the position of the sample within that tile. This is rounded to the nearest 4 pixels, which is the size of marker I've chosen to display. As an example, the barcode AMSF292-10.COI-5P has location latitude -77.8064, longitude 177.174, which for a zoom level of 6 places it in tile [63,54].

To display the marker I also need to know where in the 256 × 256 tile I should draw the marker. Coordinates in tiles start at the top left corner:

PixelCoordinates
For the example above, the marker would be at x = 124, y = 200. This means that this barcode would have a key of [6, 63, 54, 124, 200] in the CouchDB view computed above. If we ignore the position within the tile, then this barcode belongs on tile [6, 63, 54].

To display the barcodes I added a layer to the Google Map. Whenever a map tile is drawn by Google maps, it calls a simple web service I created, and sends to that service the zoom level and tile coordinates for the tile it wants to draw. I then lookup that key [zoom, x, y] in CouchDB, and return all the points within that tile as a 256 x 256 SVG image. Google Maps then draws that over its own tile, and as a result the user sees both the Google Map and the location of the barcodes. To keep things manageable I only generate tiles down to zoom level 6. After that, the barcodes simply disappear.

So, with some fairly trivial coding, I've created a map tile server in CouchDB that displays over a million barcodes in Google Maps.

Barcodebig

Hit testing


Of course, a map by itself is a bit boring. What you want to do is be able to click on a point and get some more information. If you are using the Google Maps API to add markers, then it's pretty easy to handle user clicks and do something with them. But because I'm using tiles I can't use that approach. Instead what I do is capture any clicks on the map, convert that click to tile coordinates, then query CouchDB to see if any barcodes full within that location. If so, I display them down the right side of the map. It's a bit finicky about where you click on the map, but seems to work. It would be fun to extend this approach to the GBIF map, so that you could click on a point and see what GBIF says is there.

Summary


This is all a bit crude, but as far as I'm aware this is the only interactive map of all DNA barcodes (at least, the publicly available animal barcodes). There's a lot more that could be done with this, but for now it's functional. Take it for a spin at http://iphylo.org/~rpage/bold-map/, I'd welcome any comments. If you are curious about the technical details, the source code is on GitHub at https://github.com/rdmpage/bold-map.

Friday, March 07, 2014

GBIF data overlayed on Google Maps

SquareAs part of a project exploring GBIF data I've been playing with displaying GBIF data on Google Maps. The GBIF portal doesn't use Google Maps, which is a pity because Google's terrain and satellite layers are much nicer than the layers used by GBIF (I gather there are issues with the level of traffic that GBIF receives is above the threshold at which Google starts charging for access).

But because the GBIF developers have a nice API it's pretty easy to put GBIF data on Google maps, like this (the map is live):


The source code for this map is available as a gist, and you can see it live above, and at http://bl.ocks.org/rdmpage/9411457.

Monday, March 03, 2014

GBIF liverwort taxonomy broken

Lunularia cruciataA quick note to myself to document a problem with the GBIF classification of liverworts (I've created issue POR-1879 for this).

While building a new tool to browse GBIF data I ran into a problem that the taxon "Jungermanniales" popped up in two different places in the GBIF classification, which broke a graphical display widget I was using.

If you search GBIF for Jungermanniales you get two results, both listed as "accepted":
Jungermanniales

Plantae > Marchantiophyta > Jungermanniopsida

Jungermanniales

Plantae > Bryophyta > Jungermanniopsida

Based on Wikipedia pages for
Marchantiophyta, traditionally liverworts such as the Jungermanniales were included in the Bryophyta, but are now placed in the Marchantiophyta. The GBIF classification has both the old and the new placement for liverworts (sigh).

As an aside, I couldn't figure out why Wikipedia gave the following as the reference for the publication of the name "Marchantiophyta":
Stotler, R., & Crandall-Stotler, B. (1977). A Checklist of the Liverworts and Hornworts of North America. The Bryologist. JSTOR. doi:10.2307/3242017

This paper doesn't mention "Marchantiophyta" anywhere. The other authority Wikipedia gives is:
Crandall-Stotler, B., Stotler, R. E., Long, D. G., & Goffinet, B. (2001). Morphology and classification of the Marchantiophyta. (A. J. Shaw, Ed.)Bryophyte Biology. Cambridge University Press. doi:10.1017/cbo9780511754807.002

which is behind a paywall that my University doesn't subscribe too. However, the following reference
Stotler, R., & Crandall-Stotler, B. (2008). Correct Author Citations for Some Upper Rank Names of Liverworts (Marchantiophyta). Taxon, 57(1):289-292. jstor:25065970

states that:

Marchantiophyta was validly published (Crandall Stotler & Stotler, 2000) by reference to the Latin description of Hepatophyta in Stotler & Crandall-Stotler (1977:425), a designation formed from an illegitimate generic name, Hepatica Adans. non Mill, and hence not validly published under Article 16.1, cross-referenced in Article 32.1(c) of the ICBN (McNeill & al, 2006). Marchantiophyta phylum nov. is redundant in Doweld (2001) who established a later isonym by likewise citing the Latin description in Stotler & Crandall-Stotler (1977) for his proposed "new name."

And who said taxonomy couldn't be fun?

Wednesday, February 19, 2014

Five Stages of Data Grief

OdiThere is a great post by Jeni Tennison on the Open Data Institute blog entitled Five Stages of Data Grief. It resonates so much with my experience working with biodiversity data (such as building BioNames, or exploring data errors in GBIF) that I've decide to reproduce it here.

Five Stages of Data Grief

by Jeni Tennison (@JeniT)

As organisations come to recognise how important and useful data could be, they start to think about using the data that they have been collecting in new ways. Often data has been collected over many years as a matter of routine, to drive specific processes or sometimes just for the sake of it. Suddenly that data is repurposed. It is probed, analysed and visualised in ways that haven’t been tried before.

Data analysts have a maxim:

If you don’t think you have a quality problem with your data, you haven’t looked at it yet.

Every dataset has its quirks, whether it’s data that has been wrongly entered in the first place, automated processing that has introduced errors, irregularities that come from combining datasets into a consistent structure or simply missing information. Anyone who works with data knows that far more time is needed to clean data into something that can be analysed, and to understand what to leave out, than in actually performing the analysis itself. They also know that analysis and visualisation of data will often reveal bugs that you simply can’t see by staring at a spreadsheet.

But for the people who have collected and maintained such data — or more frequently their managers, who don’t work with the data directly — this realisation can be a bit of a shock. In our last ODI Board meeting, Sir Tim Berners-Lee suggested that the data curators need to go through was something like the five stages of grief described by the Kübler-Ross model.

So here is an outline of what that looks like.

Denial

This can’t be right: there’s nothing wrong with our data! Your analysis/code/visualisation must be doing something wrong.

At this stage data custodians can’t believe what they are seeing. Maybe they have been using the data themselves but never run into issues with it because they were only using it in limiting ways. Maybe they had only ever been collecting the data, and not actually using it at all. Or maybe they had been viewing it in a form where the issues with data quality were never surfaced (it’s hard to spot additional spaces, or even zeros, when you just look at a spreadsheet in Excel, for example).

So the first reason that they reach for is that there must be something wrong with the analysis or code that seems to reveal issues with the data. There may follow a wild goose chase that tries to track down the non-existent bug. Take heart: this exercise is useful in that it can pinpoint the precise records that are causing the problems in the first place, which forces the curators to stop denying them.

Anger

Who is responsible for these errors? Why haven’t they been spotted before?

As the fact that there are errors in the data comes to be understood, the focus can come to rest on the people who collect and maintain the data. This is the phase that the maintainers of data dread (and can be a reason for resisting sharing the data in the first place), because they get blamed for the poor quality.

This painful phase should eventually result in an evaluation of where errors occur — an evaluation that is incredibly useful, and should be documented and kept for the Acceptance phase of the process — and what might be done to prevent them in future. Sometimes that might result in better systems for data collection but more often than not it will be recognised that some of the errors are legacy issues or simply unavoidable without massively increasing the maintenance burden.

Bargaining

What about if we ignore these bits here? Can you tweak the visualisation to hide that?

And so the focus switches again to the analysis and visualisations that reveal the problems in the data, this time with an acceptance that the errors are real, but a desire to hide the problems so that they’re less noticeable.

This phase puts the burden on the analysts who are trying to create views over the data. They may be asked to add some special cases, or tweak a few calculations. Areas of functionality may be dropped in their entirety or radically changed as a compromise is reached between utility of the analysis and low quality data to feed it.

Depression

This whole dataset is worthless. There’s no point even trying to capture this data any more.

As the number of exceptions and compromises grows, and a realisation sinks in that those compromises undermine the utility of the analysis or visualisation as a whole, a kind of despair sets in. The barriers to fixing the data or collecting it more effectively may seem insurmountable, and the data curators may feel like giving up trying.

This phase can lead to a re-examination of the reasons for collecting and maintaining the data in the first place. Hopefully, this process can aid everyone in reasserting why the data is useful, regardless of some aspects that are lower quality than others.

Acceptance

We know there are some problems with the data. We’ll document them for anyone who wants to use it, and describe the limitations of the analysis.

In the final stage, all those involved recognise that there are some data quality problems, but that these do not render the data worthless. They will understand the limits of analyses and interpretations that they make based on the data, and they try to document them to avoid other people being misled.

The benefits of the previous stages are also recognised. Denial led to double-checking the calculations behind the analyses, making them more reliable. Anger led to re-examination of how the data was collected and maintained, and documentation that helps everyone understand the limits of the data better. Bargaining forced analyses and visualisations to be focused and explicit about what they do and don’t show. Depression helped everyone focus on the user needs from the data. Each stage makes for a better end product.


Of course doing data analysis isn’t actually like being diagnosed with a chronic illness or losing a loved one. There are things that you can do to remedy the situation. So I think we need to add a sixth stage to the five stages of data grief described above:

Hope

This could help us spot errors in the data and fix them!

Providing visualisations and analysis provides people with a clearer view about what data has been captured and can make it easier to spot mistakes, such as outliers caused by using the wrong units when entering a value, or new categories created by spelling mistakes. When data gets used to make decisions by the people who capture the data, they have a strong motivation to get the data right. As Francis Irving outlined in his recent Friday Lunchtime Lecture at ODI, Burn the Digital Paper, these feedback loops can radically change how people think about data, and use computers within their organisations.

Making data open for other people to look at provides lots more opportunities for people to spot errors. This can be terrifying — who wants people to know that they are running their organisation based on bad-quality data? — but those who have progressed through the five stages of data grief find hope in another developer maxim:

Given enough eyeballs, all bugs are shallow.

Linus’s Law, The Cathedral and the Bazaar by Eric Raymond

The more people look at your data, the more likely they are to find the problems within it. The secret is to build in feedback mechanisms which allow those errors to be corrected, so that you can benefit from those eyes and increase your data quality to what you thought it was in the first place.


Monday, February 10, 2014

Mark-up of biodiversity literature

UnknownI gave a remote presentation at a proiBioSphere workshop this morning. The slides are below (to try and make it a bit more engaging than a desk of Powerpoints I played around with Prezi).


There is a version on Vimeo that has audio as well.


I sketched out the biodiversity "knowledge graph", then talked about how mark-up relates to this, finishing with a few questions. The question that seems to have gotten people a little agitated is the relative importance of markup versus, say, indexing. As Terry Catapano pointed out, in a sense this is really a continuum. If we index content (e.g., locate a string that is a taxonomic name) and flag that content in the text, then we are adding mark-up (if we don't, we are simply indexing, but even then we have mark-up at some level, e.g. "this term occurs some where on this page"). So my question is really what level of markup do we need to do useful work? Much of the discussion so far has centered around very detailed mark-up (e.g., the kind of thing ZooKeys does to each article). My concern has always been how scalable this is, given the size of the taxonomic literature (in which ZooKeys is barely a blip). It's the usual trade off, do we go for breadth (all content indexed, but little or no mark-up), or do we go for depth (extensive mark-up for a subset of articles)? Where you stand on that trade off will determine to what extent you want detailed mark up, versus whether indexing is "good enough".

Friday, January 24, 2014

NCBI taxonomy database now shows type material

26243 367877492480 367794192480 4194340 6124010 nScott Federhen told me about a nice new feature in GenBank that he's described in a piece for NCBI News. The NCBI taxonomy database now shows a its of type material (where known), and the GenBank sequence database "knows: about types. Here's the summary:

The naming, classification and identification of organisms traditionally relies on the concept of type material, which defines the representative examples ("name-bearing") of a species. For larger organisms, the type material is often a preserved specimen in a museum drawer, but the type concept also extends to type bacterial strains as cultures deposited in a culture collection. Of course, modern taxonomy also relies on molecular sequence information to define species. In many cases, sequence information is available for type specimens and strains. Accordingly, the NCBI has started to curate type material from the Taxonomy database, and are using this data to label sequences from type specimens or strains in the sequence databases. The figure below shows type material as it appears in the NCBI taxonomy entry and a sequence record for the recently described African monkey species, Cercopithecus lomamiensis.
Cercopithecus

You can query for sequences from type using the query "sequence from type"[filter]. This could lead to some nice automated tools. If you had a bunch of distinct clusters of sequences that were all labelled with the same species name, and one cluster includes a sequence form the type specimen, then the other clusters are candidates for being described as new names.

VertNet starts issue tracking using GitHub

VN Short LogoVertNet has announced that they have implemented issue tracking using GitHub. This is a really interesting development, as figuring out how to capture and make use of annotations in biodiversity databases is a problem that's attracting a lot of attention. VertNet have decided to use GitHub to handle annotations, but in a way that hides most of GitHub from users (developers tend to love things like GitHub, regular folks, not so much, see The Two Cultures of Computing).

The VertNet blog has a detailed walk through of how it works. I've made some comments on that blog, but I'll repeat them here.

At the moment the VertBet interface doesn't show any evidence of issue tracking (there's a link to add an issue, but you can't see if there are any issues). For example, visiting an example CUMV Amphibian 1766 I don't see any evidence on that page that there is an issue for this record (there is an issue, see https://github.com/cumv-vertnet/cumv-amph/issues/1). It think it's important that people see evidence of interaction (that way you might encourage others to participate). This would also enable people to gauge how active collection managers are in resolving issues ("gee, they fixed this problem in a couple of days, cool").

Likewise, it would be nice to have a collection-level summary in the portal. For example, looking at CUMV Amphibian 1766 I'm not able to click through to a page for CUMV Amphibians (why can't I do this at the moment - there needs to be a way for me to get to the collection from a record) to see how many issues there are for the whole collection, and how fast they are being closed.

I think the approach VertNet are using has a lot of potential, although it sidesteps some of the most compelling features of GitHub, namely forking and merging code and other documents. I can't, for example, take a record, edit it, and have those edits merged into the data. It's still a fairly passive "hey, there's a problem here", which means that the burden is still on curators to fix the issue. This raises the whole question of what to do with user-supplied edits. There's a nice paper regarding validating user input into Freebase that is relevant here, see "Trust, but Verify: Predicting Contribution Quality for Knowledge Base Construction and Curation" (http://dx.doi.org/10.1145/2556195.2556227 [not live yet], PDF here).

Wednesday, January 15, 2014

What I'll be working on in 2014: knowledge graphs and Google forests

More for my own benefit than anything else I've decided to list some of the things I plan to work on this year. If nothing else, it may make sobering reading this time next year.

A knowledge graph for biodiversity


Google's introduction of the "knowledge graph" gives us a happy phrase to use when talking about linking stuff together. It doesn't come with all the baggage of the "semantic web", or the ambiguity of "knowledge base". The diagram below is my mental model of the biodiversity knowledge graph (this comes from http://dx.doi.org/10.7717/peerj.190, but I sketched most of this for my Elsevier Challenge entry in 2008, see http://dx.doi.org/10.1038/npre.2008.2579.1).

Fig 1 1x

Parts of this knowledge graph are familiar: articles are published in journals, and have authors. Articles cite other articles (represented by a loop in the diagram below). The topology of this graph gives us citation counts (number of times an article has been cited), impact factor (citations for articles in a given journal), and author-based measures such as the H-index (a function of the distribution of citations for each article you have authored). Beyond simple metrics this graph also gives us the means to track the provenance of an idea (by following the citation trail).

Publication

The next step is to grow this graph to include the other things we care about (e.g., taxa, taxon names, specimens, sequences, phylogenies, localities, etc.).

BioNames


I spent a good deal of last year building BioNames (for background see my blog posts or read the paper in PeerJ http://dx.doi.org/10.7717/peerj.190). BioNames represents a small corner of the biodiversity knowledge graph, namely taxonomic names and their associated publications (with added chocolately goodness of links to taxon concepts and phylogenies). In 2014 I'll continue to clean this data (I seem to be forever cleaning data). So far BioNames is restricted to animal names, but now that the plant folks have relaxed their previously restrictive licensing of plant data (see post on TAXACOM) I'm looking at adding the million or so plant names (once I've linked as many as possible to digital identifiers for the corresponding publications).

Spatial indexing


Now that I've become more involved in GBIF I'm spending more time thinking about spatial indexing, and our ability to find biodiversity data on a map. There's a great Google ad that appeared on UK TV late last year. In it, Julian Bayliss recounts the use of Google Earth to discover of virgin rainforest (the "Google forest") on Mount Mabu in Mozambique.


It's a great story, but I keep looking at this and wondering "how did we know that we didn't know anything about Mount Mabu?" In other words, can we go to any part of the world and see what we know about that area? GBIF goes a little way there with its specimen distribution maps, which gives some idea of what is now known from Mount Mabu (although the map layers used by GBIF are terrible compared to what Google offers).

Mabu

But I want to be able to see all the specimens now known from this region (including the new species that have been discovered, e.g. see http://dx.doi.org/10.1007/s12225-011-9277-9 and http://dx.doi.org/10.1080/21564574.2010.516275). Why can't I have a list of publications relevant to this area (e.g., species descriptions, range extensions, ecological studies, conservation reports)? What about DNA sequences from material in this region (e.g., from organismal samples, DNA barcodes, metagenomics, etc.)? If GBIF is to truly be a "Global Biodiversity Information Facility" then I want it to be able to provide me with a lot more information than it currently does. The challenge is how to enable that to happen.

Thursday, January 09, 2014

Annotating GBIF: some thoughts

Given that it's the start of a new year, and I have a short window before teaching kicks off in earnest (and I have to revise my phyloinformatics course) I'm playing with a few GBIF-related ideas. One topic which comes up a lot is annotating and correcting errors. There has been some work in this area [1][2] bit it strikes me as somewhat complicated. I'm wondering whether we couldn't try and keep things simple.

From my perspective there are a bunch of problems to tackle. The first is that occurrence data that ends up in GBIF may be incorrect, and it would be nice if GBIF users could (at the very least) flag those errors, and even better fix them if they have the relevant information. For example, it may be clear that a frog apparently in the middle of the ocean is there because latitude and longitudes were swapped, and this could be easily fixed.

Another issue is that data on an occurrence may not be restricted to a single source. It's tempting to think, for example, that the museum housing a specimen has the authoritative data on that specimen, but this need not be the case. Sometimes museums either lack (or decide not to make available) data such as geographic coordinates, but this information is available from other sources (such as the primary literature, or GenBank, see e.g. Linking GBIF and GenBank). Speaking of Genbank, there is a lot of basic biodiversity data in GenBank (such as georeferenced voucher specimens) and it would be great to add that data to GBIF. One issue, however, is that some of the voucher specimens in GenBank will already be in GBIF, potentially creating duplicate records. Ideally each specimen would be represented just once in GBIF, but for a bunch of reasons this is tricky to do (for a start, few specimens have globally unique identifiers, see DOIs for specimens are here, but we're not quite there yet), hence GBIF has duplicate specimen records. So, we are going to have to live with multiple records for the 'same" thing.

Lastly there is the ongoing bugbear that URLs for GBIF occurrences are not stable. This is frustrating in the extreme because it defeats any attempt to link these occurrences to other data (e.g., DNA sequences, the Biodiversity Heritage Library, etc.). If the URLs regularly break then there is little incentive to go to the trouble of creating links between different data bases, and biodiversity data will remain in separate silos.

So, we have three issues: user edits and corrections of data hosted by GBIF, multiple sources of data on the same occurrence, and lack of persistence links to occurrences.

If we accept that the reality is we will always have duplicates, then the challenge becomes how to deal with them. Let's imagine that we have multiple instances of data on the same occurrence, and that we have some way of clustering those records together (e.g., using the specimen code, the Darwin Core Triple, additional taxonomic information, etc.). Given that we have multiple records we may have multiple values for the same item, such as locality, taxon name, geo-coordinates, etc. One way to reconcile these is to use an approach developed for handling bibliographic metadata derived from citations, as described in [3](PDF here). If you are building a bibliographic database from lists of literature cited, you need to cluster the citations that are sufficiently similar to be likely to be the same reference. You might also want to combine those records to yield a best estimate of the metadata for the actual reference (in other words, one author might have cited the article with an abbreviated journal name, another author might have cited only the first page, etc., but all might agree on the volume the article occurs in). Councill et al. use Bayesian belief networks to derive an estimate of the correct metadata.

What is nice about this approach is that you retain all the original data, and you can weight each source by some measure of its reliability (i.e., the "prior"). Hence, we could weight a user's edits based on some measure, such as the acceptance of other edits they've made or, say, their authority (a user who is the author of a taxonomic revision of a group might know quite a bit about the specimens belonging to those taxa). If a user edits a GBIF record (say, but adding latitude and longitude values) we could add that as a "new" record, linked to the original, and containing just the edited values (we could also enable the user to confirm that other values are correct).

So, what do we show regular users of GBIF if we have multiple records for the same occurrence? In effect we compute a "consensus" based on the multiple records, tackling into account the prior probabilities that each source is reliable. What about the museums (or other "providers")? Well, they can grab all the other records (e.g., the user edits, the GenBank information, etc.) and use it to update their records, if they so choose. If they do so, next time GBIF harvest their data, the GBIF version of that data is updated, and we can recompute the new "consensus". It would be nice to have some way of recording whether the other edits/records we accepted, so we can gauge the reliability of those sources (a user whose edits are consistently accepted gets "up voted"). The provider could explicitly tell GBIF which edits it accepted, or we could infer them by comparing the new and old versions.

To retain a version history we'd want to keep the new and old provider records. This could be done using timestamps - any record has a creation date, and an expiry date. By default the expiry date is far in the future, but if a record is replaced it's expiry date is set to that time, and it is ignored when indexing the data.

How does this relate to duplicates? Well, GBIF has a habit of deleting whole sets of data if it indexes data from a provider and that provider has done something foolish, such as change the fields GBIF uses to identify the record (another reason why globally unique identifiers for specimens can't come soon enough). Instead of deleting the old records (and breaking any links to those records) GBIF could simply set their expiry date but keep them hanging around. They would not be used to create consensus records for an occurrence, but if someone used a link that had a now deleted occurrence id they could be redirected to the current cluster that corresponds to that old id, and hence the links would be maintained (albeit pointing to possibly edited data).

This is still a bit half-baked, but I think the challenge GBIF faces is how to make the best of messy data which may lack a single definitive source. The ability for users to correct GBIF-hosted data would be a big step forward, as would the addition of data from Genbank and the primary literature (the later has the advantage that in many cases it will presumably have been scrutinised by experts). The trick is to make this simple enough that there is a realistic chance of it being implemented.

References


[1] Wang, Z., Dong, H., Kelly, M., Macklin, J. A., Morris, P. J., & Morris, R. A. (2009). Filtered-Push: A Map-Reduce Platform for Collaborative Taxonomic Data Management. 2009 WRI World Congress on Computer Science and Information Engineering (pp. 731–735). Institute of Electrical and Electronics Engineers. doi:10.1109/CSIE.2009.948

[2] Morris, R. A., Dou, L., Hanken, J., Kelly, M., Lowery, D. B., Ludäscher, B., Macklin, J. A., et al. (2013). Semantic Annotation of Mutable Data. (I. N. Sarkar, Ed.)PLoS ONE, 8(11), e76093. doi:10.1371/journal.pone.0076093

[3] Councill, I. G., Li, H., Zhuang, Z., Debnath, S., Bolelli, L., Lee, W. C., Sivasubramaniam, A., et al. (2006). Learning metadata from the evidence in an on-line citation matching scheme. Proceedings of the 6th ACM/IEEE-CS joint conference on Digital libraries - JCDL ’06 (p. 276). Association for Computing Machinery. doi:10.1145/1141753.1141817


Thursday, December 12, 2013

Guest post: response to "Putting GenBank Data on the Map"

DES Tahiti 09 biggerThe following is a guest blog post by David Schindel and colleagues and is a response to the paper by Antonio Marques et al. in Sciencedoi:10.1126/science.341.6152.1341-a.

Marques, Maronna and Collins (1) rightly call on the biodiversity research community to include latitude/longitude data in database and published records of natural history specimens. However, they have overlooked an important signal that the community is moving in the right direction. The Consortium for the Barcode of Life (CBOL) developed a data standard for DNA barcoding (2) that was approved and implemented in 2005 by the International Nucleotide Sequence Database Collaboration (INSDC; GenBank, ENA and DDBJ) and revised in 2009. . All data records that meet the requirements of the data standard include the reserved keyword 'BARCODE'. The required elements include: (a) information about the voucher specimen from which the DNA barcode sequence was derived (e.g., species name, unique identifier in a specimen repository, country/ocean of origin); (b) a sequence from an approved gene region with minimum length and quality; and (c) primer sequences and the forward and reverse trace files. Participants in the workshops that developed the data standard decided to include latitude and longitude as strongly recommended elements but not as strict requirements for two reasons. First, many voucher specimens from which BARCODE records are generated may have been collected before GPS devices were available. Second, barcoding projects such as the Barcode of Wildlife Project (4) are concentrating on rare and endangered species. Publishing the GPS coordinates of collecting localities would facilitate illegal collecting and trafficking that could contribute to biodiversity loss.

The BARCODE data standard is promoting precisely the trend toward georeferencing called for by Marques, Marrona and Collins. Table 1 shows that there are currently 346,994 BARCODE records in INSDC (3). Of these BARCODE records, 83% include latitude/longitude data. Despite not being a required element in the data standard, this level of georeferencing is much higher than for all cytochrome c oxidase I gene (COI), the BARCODE region, 16S rRNA, and cytochrome b (cytb), another mitochondrial region that was used used for species identification prior to the growth of barcoding. Data are also presented on the numbers and percentages of data records that include information on the voucher specimen from which the nucleotide sequence was obtained. In an increasing number of cases, these voucher specimen identifiers in INSDC are hyperlinked to the online specimen data records in museums, herbaria and other biorepositories. Table 2 provides these same data for the time interval used in the Marques et al. letter (1). These tables indicate the clear effect that the BARCODE data standard is having on the community’s willingness to provide more complete data documentation.

Table 1. Summary of metadata for GPS coordinates and voucher specimens associated with all data records.
Categories of data recordsTotal number of GenBank recordsWith Latitude/LongitudeWith Voucher or Culture Collection Specimen IDs
BARCODE347,349286,975 (83%)347,077 (~100%)
All COI751,955365,949 (49%)531,428 (71%)
All 16S4,876,284461,030 (9%)138,921 (3%)
All cytb239,7967,776 (3%)84,784 (35%)

Table 2.
Summary of metadata for GPS coordinates and voucher specimens associated with data records submitted between 1 July 2011 and 15 June 2013.
Total number of GenBank recordsWith Latitude/LongitudeWith Voucher or Culture Collection Specimen IDs
BARCODE160,615132,192 (82%)160,615 (100%)
All COI302,507166,967 (55%)231,462 (77%)
All 16S1,535,364232,567 (15%)49,150 (3%)
All cytb74,6312,920 (4%)24,386 (33%)


The DNA barcoding community's data standard is demonstrating two positive trends: better documentation of specimens in natural history collections, and new connectivity between databases of species occurrences and DNA sequences. We believe that these trends will become standard practices in the coming years as more researchers, funders, publishers and reviewers acknowledge the value of, and begin to enforce compliance with the BARCODE data standard and related minimum information standards for marker genes (5).

DAVID E. SCHINDEL1, MICHAEL TRIZNA1, SCOTT E. MILLER1, ROBERT HANNER2, PAUL D. N. HEBERT2, SCOTT FEDERHEN3, ILENE MIZRACHI3
  1. National Museum of Natural History, Smithsonian Institution Smithsonian Institution, Washington, DC 20013–7012, USA.
  2. University of Guelph, Ontario, Canada
  3. National Center for Biotechnology Information, National Library of Medicine, National Institutes of Health, Bethesda, MD, USA

References

  1. Marques, A. C., Maronna, M. M., & Collins, A. G. (2013). Putting GenBank Data on the Map. Science, 341(6152), 1341–1341. doi:10.1126/science.341.6152.1341-a
  2. Consortium for the Barcode of Life, http://www.barcodeoflife.org/sites/default/files/DWG_data_standards-Final.pdf (2009)
  3. Data in Tables 1 and 2 were drawn from GenBank (http://www.ncbi.nlm.nih.gov/genbank/) [data as of 1 October 2013]
  4. Barcode of Wildlife Project, http://www.barcodeofwildlife.org (2013)
  5. Yilmaz, P., Kottmann, R., Field, D., Knight, R., Cole, J. R., Amaral-Zettler, L., Gilbert, J. A., et al. (2011). Minimum information about a marker gene sequence (MIMARKS) and minimum information about any (x) sequence (MIxS) specifications. Nature Biotechnology, 29(5), 415–420. doi:10.1038/nbt.1823

Wednesday, December 04, 2013

Towards BioStor articles marked up using Journal Archiving Tag Set

A while ago I posted BHL to PDF workflow which was a sketch of a work flow to generate clean, searchable PDFs from Biodiversity Heritage Library (BHL) content:

Workflow
I've made some progress on putting this together, as well as expanded the goal somewhat. In fact, there are several goals:
  1. BioStor articles need to be archived somewhere. At the moment they live on my server, and metadata is also served by BHL (as the "parts" you see in a scanned volume). Long term maybe PubMed Central is a possibility (BHL essentially becomes a publisher). Imagine PubMed Central becoming the primary archival repository for biodiversity literature.
  2. BioStor articles could be more useful if the OCR text was cleaned up and marked up (e.g., highlighting taxon names, localities, extracting citations, etc.).
  3. If BioStor articles were marked up to same extent as ZooKeys then we could use tools developed for ZooKeys (see Towards an interactive taxonomic article: displaying an article from ZooKeys) for a richer reading experience.
  4. Cleaned OCR text could also be used to generate searchable PDFs, which are still the most popular way for people to read articles (see Why do scientists tend to prefer PDF documents over HTML when reading scientific journals?). BioStor already generates PDFs, but these are simply made by wrapping page images in a PDF. Searchable PDFs would be much friendlier.

For BioStor articles to be archived in PubMed Central they would need to be marked up using the Journal Archiving and Interchange Tag Suite (formerly the NLM DTDs). This is the markup used by many publishers, and also the tag suite that TaxPub build upon.

The idea of having BioStor marked up in JATS is appealing, but on the face of it impossible because the all we have is page scans and some pretty ropey OCR. But because the NLM has also been heavily involed in scanning the historical literature they are used to dealing with scanned literature, and JATS can accommodate articles ranging from scans to fully marked up text. For example, take a look at the article "Microsporidian encephalitis of farmed Atlantic salmon (Salmo salar) in British Columbia" which is in PubMed Central (PMC1687123). PMC has basic metadata for the article, scans of the pages, and two images extracted from those pages. This is pretty much what BioStor already has (minus the extracted images).

With this in mind, I dusted off some old code, put it together and created an example of the first baby steps towards BioStor and JATS. The code is in github, and there is a live example here.

Jats
The example takes BioStor article 65706, converts the metadata to JATS, links in the page scans, and also extracts images from the page scans based on data in the ABBYY OCR files. I've also generated HTML from the DjVu files, and this HTML includes hOCR tags that embed information about the OCR text. This format can be edited by tools such as (see Jim Garrison's moz-hocr-edit discussed in Correcting OCR using hOCR in Firefox). This HTML can be processed to output a PDF that includes the page scans but also has the OCR text as "hidden text" so the reader can search for phrases, or copy and paste the text (try the PDF for article 65706).

I've put the HTML (and all the XML and images) in github, so one obvious model for working on an article is to put it into a github repository, push any edits made to the repository, then push that to a web server that displays the articles.

There are still a lot of rough edges, and I think we can buld nicer interfaces than moz-hocr-edit (e.g., using the "contenteditable" attribute in the HTML), althogh moz-hocr-edit has the nice feature of being able to save the edits straight back to the HTML file (saving edited HTML to disk is a non-trivial task in most web browsers). I also need to add the code for building the initial JATS file (currently this is hidden on the BioStor server). There are also issues about PDF quality. At the moment I output black and white PNGs, which look nice and clean but can mangle plates and photos. I need to tweak that aspect of the process.

One application of these tools would be to take a single journal and convert all the BioStor articles into JATS, then make it available for people to further clean and markup as needed. There is an extraordinary amount of information locked away in this literature, it would be nice if we made better use of that treasure trove.