I've always wanted to explore this idea a bit more, and have finally made a start, in part inspired by the recent VIZBI 2011 meeting. I've grabbed a large chunk of GenBank, mined the sequences for host records, and created some simple visualisations of what I'm terming (with tongue firmly in cheek) the "symbiome". Jonathan Eisen will not be happy, but I need a word that describes the complete set of hosts, mutualists, symbionts with which an organism is associated, and "symbiome" seems appropriate.
Human symbiome
To illustrate the idea, below is the human "symbiome". This diagram shows all the taxa in GenBank arranged in a circle, with lines connecting those organisms that have DNA sequences where humans are recorded as their host.
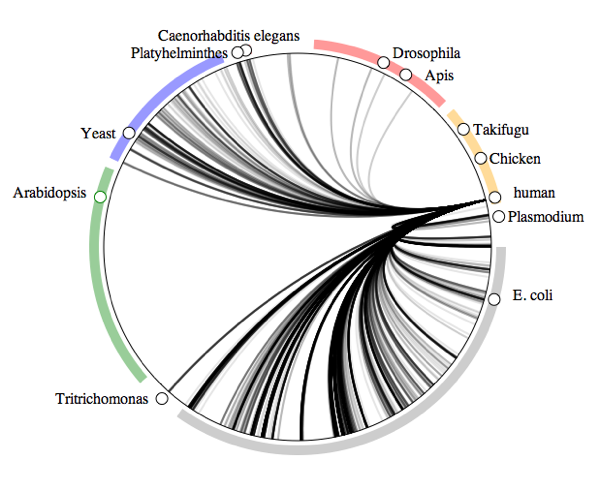
At a glance, we have a lot of bacteria (the gray bar with E. coli) and fungi (blue bar with Yeast), and a few nematodes and arthropods.
Fig tree symbiome
Next up are organisms collected from fig trees (genus Ficus).

Fig trees have wasp pollinators (the dark line landing near the honey bee Apis), as well as nematodes (dark line landing near Caenorhabditis elegans). There are also some associations with fungi and other arthropods.
Which taxa host insects?
Next up is a plot of all associations involving insects and a host.

The diagram is dominated by insect-flowering plant interactions, followed by insect-vertebrate associations (most likely bird and mammal lice).
Which taxa are hosted by insects?
We can reverse the question and ask what organisms are hosted by insects:

Lots of associations between insects and fungi, as well as bacteria, and a few other organisms, such as nematodes, and Plasmodium (the organism which causes malaria).
Frog symbiome
Lastly, below is the symbiome of frogs. "Worms" feature prominently, as well as the fungus that causes chytridiomycosis.
 How the visualisation was made
The symbiome visualisations were made as follows. Firstly DNA sequences were downloaded from EMBL and run through a script that extracted as much metadata as possible, including the contents of the
host field (where present). I then took the NCBI taxonomy and generated an ordered list of taxa by walking the tree in postorder, which determines where on the circumference of the circle the taxon lies. Pairs of taxa in an association are connected by a quadratic Bezier curve. The illustration was created using SVG.Next steps
There are several ways this visualisation could be improved. It's based only only a subset of data (I haven't run all of the sequence databases though the parser yet), and the matching of host taxa is based on exact string matching. All manner of weird and wonderful things get entered in the
host field, so we'll need some more sophisticated parsing (see "LINNAEUS: A species name identification system for biomedical literature" doi:10.1186/1471-2105-11-85 for a more general discussion of this issue).The visualisation is fairly crude at this stage. Circle plots like this are fairly simple to create, and pop up in all sorts of situations (e.g., RNA secondary structure methods, which I did some work on years ago). Of course, Circos would be an obvious tool to use to create the visualisations, but the overhead of installing it and learning how to use it meant I took a shortcut and wrote some SVG from scratch.
Although I've focussed on GenBank as a source of data, this visualisation could also be applied to other data. I briefly touched on this in Tag trees: displaying the taxonomy of names in BHL where a page in the Biodiversity Heritage Library contains the names of a flea and it's mammalian hosts. I think these circle plots would be a great way to highlight possible ecological associations mentioned in a text.