Showing posts sorted by relevance for query treemap. Sort by date Show all posts

Tuesday, June 10, 2008

Catalogue of Life as a treemap

I have an "on again/off again" relationship with treemaps. Lately, I've been taking another look, partly inspired by Björn Engdahl's MSc thesis Ordered and Unordered Treemap Algorithms and Their Applications on Handheld Devices. He describes a simple treemap algorithm which he calls Split Layout. It has the nice properties of having a good aspect ratio (most cells in the treemap are approximately square) and it keeps the cells in roughly the original order. This later property is important as one thing I find distracting with tree diagrams is if the order of the objects in the tree keep changing.

I also have an "on again/off again" relationship with the Catalogue of Life, which is potentially very useful, but seems determined to undermine this with some poor design decisions. But, I finally bit the bullet and extracted a complete classification from the 2008 edition of the Catalogue of Life. I downloaded an ISO image, burnt a CD, installed it on a Windows box (gack), grabbed the MySQL database files, and put those on my MacBook Air. Using some tools I developed for working with the NCBI taxonomy, I wanted to extract the tree from the taxa table, only to discover that this table isn't a tree. Not all the taxa in the table are flagged is_accepted_name, and if you remove those, then the remaining taxa don't form a tree. It's clear that some taxa have been orphaned when the table was created. For example, Enteromorpha flexuosa is not an accepted name, and is flagged as such in the taxa table, yet it is has four child taxa that are accepted (Enteromorpha flexuosa subsp. linziformis, Enteromorpha flexuosa subsp. biflagellata, Enteromorpha flexuosa subsp. pilifera, and Enteromorpha flexuosa forma submarina). These taxa are orphaned in the tree. Eventually I gave up trying to extract the tree using SQL, and had to traverse the entire structure starting at the root node. This extracts a tree, at the cost of the orphans. It appears that Catalogue of Life haven't checked whether there classification is, in fact, a tree (OK, technically it is a forest as it is a set of disjoint trees comprising the eight kingdoms CoL recognises, but I make it a tree by rooting it on a node called "life").

After much anguish, I have a tree. I then coded up Engdahl's algorithm, based on the pseudocode he provides on p. 31 of his thesis (I think there's a bug in his code as he doesn't deal with the case when the cell being partitioned is narrower than it is wide, but this was easy to fix). One thing I was keen to do is just use HTML, no SVG or Flash. Here's an example of the treemap, showing the eight kingdoms. Each taxon is drawn proportional to log10(n + 1), where n is the number of terminal taxa (i.e., species or below) in that taxon (the number of terminals is shown in each cell). The log scale was chosen to avoid mega-diverse groups crowding out the smaller taxa.


Animalia 892,966

Archaea 281

Bacteria 9,588

Chromista 6,855

Fungi 33,017

Plantae 206,843

Protozoa 6,435

Viruses 1,906


The live version is here. It's a bit crude (to go back up the tree just use your browser back button), but it's simple, and it's HTML. The underlying code is PHP, but it would be quite easy to convert this to Javascript to make a simple drop in widget. In addition to Björn Engdahl's algorithm, and the Catalogue of Life data, I should acknowledge Samson's code for generating colour gradients.

There are all sorts of things that could be done to improve this. One approach would be to include exemplar pictures of the taxa in each cell, to help navigate in unfamiliar taxa. Denise Green and Rebecca Shapley's Teaching with a visual tree of life report has some examples of this idea (see their p. 86), and Marcos Weskamp (author of the very cool newsmap) has done a mockup for EOL using Flash.

As to the treemap idea itself, there are some fun things which could be done with it. I'm not convinced that it is great for navigation. However, it is probably very useful for showing changes over time. For example, imagine making the State of Observed Species report dynamic. Take the uBio RSS feed for new names, classify the new names, then colour the treemap cells by the number of new names (in a sense, this is a taxonomic version of newsmap).

Tuesday, June 12, 2012

Using a zoomable treemap to visualise a taxonomic classification

One visualisation method I keep coming back too is the treemap. Each time I experiment with them I learn a little bit more, but I usually end up abandoning them (with the exception of using quantum treemaps to display bibliographic data). But they keep calling me back.

My latest experiment builds on some earlier thoughts on quantum treemaps, but tackles two issues that have kept bugging me. The first is that quantum treemaps are limited to hierarchies that are only two levels deep (e.g., family → genus → species). This is because, unlike regular treemaps where you are slicing and dicing a rectangle of predetermined size, when you construct a quantum treemap you don't know how big it will be until you've made it (this is because you want to ensure that every item in the hierarchy can be displayed at the same size, and fitting them in may require you to tweak the size of the treemap). Given that taxonomic classifications have > 2 levels this is a problem. One approach is to construct quantum treemaps for the lower parts of the classification, then pack those into a larger rectangle. This is an instance of the packing problem. After Googling for a bit I came up across this code for packing rectangles, which was easy to follow and gave reasonable results.

The second problem is that I want the treemap to be interactive. I want to be able to zoom in and out and navigate around the treemap. After more Googling, I came across the Zoomooz.js library which makes web page elements zoom (for a pretty mind-blowing example of what can be done see impress.js), but I decided I want to work with SVG. After playing with examples from Keith Wood's jQuery SVG plugin I started to get the hang of creating zoomable visualisations in SVG.

Here's a video of what I've come up with so far (you can see this live at http://iphylo.org/~rpage/zoomrect/primates.html). This is an interactive display of the Catalogue of Life 2010 classification of primates, with images from EOL. It's crude, there are some obvious issues with redrawing images, labels, etc., but it gives a sense of what can be done. With care this could probably be scaled up to handle the entire Catalogue of Life classification. With a bit more care, it could probably be optimised for the iPad, which would be a fun way to navigate through the diversity of life.

Monday, January 25, 2010

Displaying taxonomic coverage using a treemap

A quick, and not altogether satisfactory hack, but I've added a simple interactive treemap to BioStor. It's essentially a remake of the Catalogue of Life treemap I created in 2008, but coloured by the number of references I've extracted from BHL. I wanted a quick way to visualise which groups were well represented (darker colours), and which weren't (lighter colours). For example, in the diagram below we can see that Annelida, Arthropoda, Chordata, Cnidaria, and Mollusca have most of the references.
tm.png

The treemap at BioStor is interactive. You can click on a panel in the treemap to drill down. To go back up, click on the desired level in the tree displayed to the left of the treemap.

Tuesday, January 18, 2011

Quantum treemaps meet BHL and the Australian Faunal Directory

One of the things I'm enjoying about the Australian Faunal Directory on CouchDB is the chance to play with some ideas without worrying about breaking lots of code or, indeed, upsetting any users ('cos, let's face it, there aren't any). As a result, I can start to play with ideas that may one day find their way into other projects.

One of these ideas is to use quantum treemaps to display an author's publications. For example, below is a treemap showing publications by G A Boulenger in my Australian Faunal Directory on CouchDB project. The publications are clustered by journal. If a publication has been found in BioStor the treemap displays a thumbnail of that publication, otherwise it shows a white rectangle. At a glance we can see where the gaps are. You can view a publication's details simply by clicking on it.

boulenger.png

The entomologist W L Distant has a more impressive treemap, and clearly I need to find quite a few of his publications.
distant.png
I quite like the look of these, so may think about adding this display to BioStor. I may also think about using treemaps in my ongoing iPad projects. If you want to see where I'm going with this then take a look at Good et al. A fluid treemap interface for personal digital libraries.

Notes
The quantum treemap is computed using some rather ugly PHP I wrote, based on this Java code. I've not implemented all the refinements of the original Java code, so the quantum treemaps I create are sometimes suboptimal. To avoid too much visual cluster I haven't drawn a border around each cell, instead I use CSS gradients to indicate the area of the cell (if you're using Internet Explorer the gradient will be vertical rather than going from top left to bottom right). The journal name is overlain on the cell contents, but if you are using a decent browser (i.e., not Internet Explorer) you can still click through this text to the underlying thumbnail because the text uses the CSS property
.overlay { pointer-events: none; }
I learnt this trick from the Stack Overflow question Click through div with an alpha channel.

Monday, March 27, 2006

Quantum treemaps


One of the things that keeps bothering me is the lack of compelling ways to visualise information in phylogenetic databases. Trees themselves are, I feel, pretty awful objects to work with. They are large, and displaying them takes up a lot of screen real estate. Yet, in many ways, the more one sees of the tree the less one gains from the experience. For example, CAIDA's Walrus tool (right), used by Tim Hughes to display large trees looks fabulous, but is it useful? By which I mean, can we use it find out about stuff, or do we just spin it around and go "ohh, isn't it pretty?"

Treemaps are another tool that I've looked at, but never been terribly impressed. However, quantum treemaps, described in Ordered and Quantum Treemaps: Making Effective Use of 2D Space to Display Hierarchies, look potentially useful. To quote from the paper describing them:


The goal of the Quantum Treemap algorithm is similar to other treemap algorithms, but instead of generating rectangles of arbitrary aspect ratios, it generates rectangles with widths and heights that are integer multiples of a given elemental size. In this manner, it always generates rectangles in which a grid of elements of the same size can be layed out. Furthermore, all the grids of elements will align perfectly with rows and columns of elements running across the entire series of rectangles. It is this basic element size that cannot be made any smaller that led to the name of Quantum Treemaps


Quantum treemaps have made their way into Photomesa.

So, here's my thought. What if we used a quantum treemap to browse TreeBASE? Suppose we have a mapping between TreeBASE taxa and the NCBI taxonomy (or any other taxonomy, it doesn't really matter). If we then have some notion of what taxa each TreeBASE study is mainly about, then we could display a quantum treemap of studies rooted at any node in the NCBI taxonomy. For example, studies on mammals, grouped by order. The point here is not to see the tree, but to navigate through the studies using the tree.

Whereas treemaps usually display a nested hierarchy, my sense is that quantum treemaps are used to display the children of a node, rather than the whole tree. I think this is because the final size of a quantum treemap is unpredictable.

The mapping of TreeBASE names to NCBI tax_ids is not trivial, but I've got most of one done. Mapping studies to taxa needs a little thought. One approach is to take a tree from a study, relabel it with NCBI tax_ids, then find the least common ancestor in the NCBI taxonomy of the centroid of the tree. The idea is that this is in the core of the tree, and hence should capture what the tree is about. Finding the LCA of the root would be an obvious thing to do, but if one has a tree comprising mostly vertebrates, but rooted with a bacterium, then the root LCA is the root of life, which isn't a terribly accurate summary of the tree.

I've been playing with generating quantum treemaps, based on a C++ port of some Java code written by Ben Bederson. The next step is to try and bolt this together into a demo of how this might be used to navigate TreeBASE.

Links

Monday, November 24, 2008

What is a study about? Treemaps of taxa


One of the things I've struggled with most in putting together a web site for the challenge is how to summarise that taxonomic content of a study. Initially I was playing with showing a subtree of the NCBI taxonomy, highlighting the taxa in the study. But this assumes the user is familiar with the scientific names of most of life. I really wanted something that tells you "at a glance" what the study is about.

I've settled (for now, at least) on using a treemap of images of the taxa in the study. I've played with treemaps before, and have never been totally convinced of their utility. However, in this context I think they work well. For each paper I extract the taxonomic names (via the Genbank sequences linked to the paper), group them into genera, and then construct a treemap where the size of each cell is proportional to the number of species in each genus. Then I harvest images from Flickr and/or Yahoo's image search APIs and display a thumbnail with a link to the image source.


I'm hoping that these treemaps will give the user an almost instant sense of what the study is about, even if it's only "it's about plants". The treemap above is for Frost et al.'s The amphibian tree of life (doi:10.1206/0003-0090(2006)297[0001:TATOL]2.0.CO;2), the one to the right is for Johnson and Weese's "Geographic distribution, morphological and molecular characterization, and relationships of Lathrocasis tenerrima (Polemoniaceae)".

Note that the more taxa a study includes the smaller and more numerous the cells (see below). This may obscure some images, but gives the user the sense that the study includes a lot of taxa. The image search isn't perfect, but I think it works well enough for my purposes.

Saturday, June 11, 2011

Mendeley Hack4Knowledge: towards an "ego wall"

I'm taking a virtual part in Mendeley's Hack4Knowledge event. I'm using this a chance to explore some ideas about building novel interfaces to bibliographic data in Mendeley. One idea is to display a user's entire library in one screen. I think the user interfaces employed by most bibliographic software are too conservative and there some cool things that could be done. For example, see A fluid treemap interface for personal digital libraries (doi:10.1145/1065385.1065512, PDF available from CiteSeer).

One idea I'm playing with is to display all a Mendeley user's papers as a quantum treemap, with thumbnails of the papers and "badges" indicating, for example, how many readers each paper has. The idea is that at a glance you can see all your publications, and which ones are being read the most. You can think of it as an "ego wall" — a quick way to see what others think about your work. Below is part of my library. You can see the full treemap here as an SVG file. Imagine this as an iPad interface to a user's Mendeley library.

Wall

Eventually I'll make this live. I'm doing this yet as the script to create the visualisation is slow due to the multiple requests I need to make to get the necessary information. I have to get the list of a user's papers from Mendeley, then I call the API for each paper to get basic bibliographic details. I have to screen scrape the corresponding paper's web page to get the thumbnail and the paper's UUID, which I can then use to get the readership stats via Mendeley's API via yet another API call. Sigh.

Anyway, this is enough hacking for one day. Hope to spend some more time on this project tomorrow.


Wednesday, June 04, 2014

Visual analysis of GBIF data

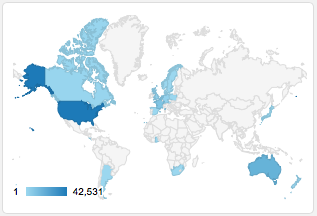
Tim Roberston and the ream at GBIF are working on some nice visualisations of GBIF data, and have made an early release available for viewing: http://analytics.gbif-uat.org. For a given country, say, the Solomon Islands, you can see numerous plots, mostly like this:

Gbif

Ever the critic, as much as I like this (and appreciate the scale of the task underlying doing analytics on data at the scale of GBIF), what I would really like to see is something that more closely resembles Google Analytics. I want graphs that I can use to get some insight into the data, and which lead me to ask questions (and provide easy for me to discover the answers).

So, I put together a crude, live demo of the sort of thing I'd like to see. You can see it at http://bionames.org/~rpage/gbif-stats (can't promise that this link will be long-lived), and below is a screen shot:
Stats
What I've done is fetch all the occurrence records for the Solomon Islands from GBIF (using the API), dumped that into CouchDB, and generated some simple queries. I display the results using Google Charts. There are some similarities with the tools developed by Javier Otegui, Arturo Ariño, and colleagues.

Otegui, J., Ariño, A. H., Encinas, M. A., & Pando, F. (2013, January 25). Assessing the Primary Data Hosted by the Spanish Node of the Global Biodiversity Information Facility (GBIF). (G. P. S. Raghava, Ed.)PLoS ONE. Public Library of Science (PLoS). doi:10.1371/journal.pone.0055144
Otegui, J., & Arino, A. H. (2012, August 15). BIDDSAT: visualizing the content of biodiversity data publishers in the Global Biodiversity Information Facility network. Bioinformatics. Oxford University Press (OUP). doi:10.1093/bioinformatics/bts359


For fun I've also added a map of the GBIF occurrences (also served from CouchDB).

Here's quick guide to some of the charts. Below you can see (left) a plot of species accumulation over time, that is the total number of species that have been collected up to that time. If we had collected all the species we'd expect this to asymptote (flatten out). If it keeps going up, then we still need to do some sampling. On the right is the number of occurrences recorded for each year. You can see that collecting is highly episodic.

Stats2

To get a little more information on this, I've generated a crude chart where the rows are institutions (e.g., museums and herbaria) that have specimens, and the number of occurrences collected each decade are represented by the shaded boxes (the rightmost box is the current decade) (if you hover over a bar you will see a popup with the decade). To the right is the total number of occurrences.

Chart
From this we can see that there have been some major collections at various times (e.g., Kew in the 1960's, the Australian Museum in the 1970's to 1990's). Strangely, the MCZ has lots of specimens from the 1700's, I suspect we have a data quality issue here. There are certainly some issues with dates in this data set, with about a quarter of occurrences with no date:

Date

Note that the data for the Solomon Islands, comes from all around the world, mostly from the US. There is a big spike in the date of collection curve in 1944, suggesting a lot of material may be the result of collecting by US servicemen in WW2.

Map

I use a treemap to display the taxonomic distribution of the records, and a donut chart to summarise the taxonomic level to which the occurrences are identified:

Taxa
The treemap is dominated by vertebrates, which I suspect is a poor reflection of the actual taxonomic composition of the Solomon Islands biota. Over 3/4 of the occurrences are identified to species level, which is encouraging, but there's clearly a lot of material that needs some taxonomic work.

Where next


This has been made in a rush, and there is a lot which could be done. For example, some of the charts would be more useful if you could drill down and explore further. This could be done via the GBIF API or portal (for example, by constructing a URL that shows the portal results for the Solomon Islands for a given year of collection).

There are, of course, issues of scalability. I've made this for the 83,364 occurrences currently in the GBIF portal for the Solomon Islands. There would need to be some thought given to how this could be scaled to larger data sets. But I think this is worth pursuing so that we can get further insights into the remarkable database that GBIF is building.

Friday, June 06, 2014

More on visualisation of GBIF data

Following on from the previous post on visualising GBIF data, I've added some more interactivity. If you click on a pane in the treemap widget you get a list of the corresponding taxa, together with an image from EOL (if one exists). It's a fun way to quickly see what sort of species are present (in this case in the Solomon Islands). You can try it at http://bionames.org/~rpage/gbif-stats/.

Stats2

Pro tip


It's not obvious from the site, but to go back up the taxonomic hierarchy in the treemap, right click (ctrl-click on a Mac) on the grey bar corresponding to the higher taxon.

Tuesday, June 22, 2010

Mashing up NCBI and Wikipedia using treemaps

Having made a first stab at mapping NCBI taxa to Wikipedia, I thought it might be fun to see what could be done with it. I've always wanted to get quantum treemaps working (quantum treemaps ensure that the cells in the treemap are all the same size, see my 2006[!] blog post for further description and links). After some fussing I have some code that seems to do the trick. As an example, here is a quantum treemap for Laurasiatheria.

qt.png
The diagram shows the NCBI taxonomy subtree rooted on Laurasiatheria, with images (where available) from Wikipedia for the children of the the children of that node. In other words, the images correspond to the tips of the tree below:

laurasiatheria.png

There's a lot to be done to tidy this up, but there is potential to create a nice, visual way to navigate through the NCBI taxonomy (it might work well on the iPhone or iPad, for example).

Tuesday, September 18, 2007

Nature Precedings


Nature precedings is pre-publication server launched by Nature a few months ago. To quote from the website:
Nature Precedings is a place for researchers to share pre-publication research, unpublished manuscripts, presentations, posters, white papers, technical papers, supplementary findings, and other scientific documents. Submissions are screened by our professional curation team for relevance and quality, but are not subjected to peer review. We welcome high-quality contributions from biology, medicine (except clinical trials), chemistry and the earth sciences.

Unable to resist, I've uploaded three manuscripts previously languishing as "Technical Reports" on my old server. The three I uploaded now have bright shiny DOIs, which may take a little while to register with CrossRef. The manuscripts are:

Treemap Versus BPA (Again): A Response to Dowling doi:10.1038/npre.2007.1030.1 (a response to a critique of my ancient TreeMap program).

On The Dangers Of Aligning RNA Sequences Using "Conserved" Motifs doi:10.1038/npre.2007.1029.1 (a short note on Hickson et al.'s (2000) use of conserved motifs to evaulate RNA alignment).

Towards a Taxonomically Intelligent Phylogenetic Database doi:10.1038/npre.2007.1028.1 (a paper written for DBiBD 2005, basically a rewrite of a grant proposal).

All three are under the evolution and ecology subject heading. Visitors to Nature precedings can comment on papers, and vote for which ones they like. The fact that I've uploaded some manuscripts probably says nothing good about me, but I'll be checking every so often to see if anybody has anything to say...

Thursday, August 15, 2013

BioNames update - taxonomic name timelines

One feature I've always wanted to have in BioNames is a timeline of taxonomic names. ION has one (see here), but I wanted a way to go from the timeline to the actual publications. In other words, if, say, there were approximately 99 bird names published in 2012, I want to see the papers that published those names.

As an example, you can go to http://bionames.org/timeline/Animalia/Chordata/Vertebrata/Aves and get a timeline of bird names:
Birds
The data is incomplete (I'm still processing and indexing the data) but you get a sense that the number of bird names being coined each year is fairly small. Actually, I was surprised it was as high as it is, but remember these are not the number of new species described each year. It does include new species (many of them are fossils in this case), but also higher taxa and nomenclatural changes (e.g., replacement names for homonyms, etc.). The timeline also only shows names that are "new" (i.e., not the new combinations that result when a species gets moved to a new genus), and only those names linked to a publication.

The timeline graphs are clickable, so you can click on a year and get a list of publications for that taxon for that year (sometimes this can take a while). You can click on the publications for more details, sometimes you can also view the full text.

The timeline page also shows a treemap of the taxonomic groups recognised by the ION database (the example below is for birds):

Treemap

Browsing different taxa shows some interesting patterns. For example, here are snakes:

Snakes
That huge spike on the far right? That's due to hundreds of names published by "Snake Man" Raymond Hoser (his activities have been the subject of an impassioned debate on TAXACOM).

The timeline for insects shows a major dip in new names that corresponds to the Second World War, followed by a big jump in the late sixties.

Insects

Smaller taxa, such as Teuthida, show a more episodic pattern where a single monograph can result in a prominent spike in the numbers in any one year (again, you can click on the spikes to see the actual publications):

Squid

Still a daunting mount of cleaning and linking to do, but it's one more way to explore the efforts of generations of taxonomists to discover and make sense of the diversity of animal life on the planet.


Tuesday, November 23, 2021

Revisiting RSS to monitor the latest taxonomic research

Over a decade ago RSS (RDF Site Summary or Really Simple Syndication) was attracting a lot of interest as a way to integrate data across various websites. Many science publishers would provide a list of their latest articles in XML in one of three flavours of RSS (RDF, RSS, Atom). This led to tools such as uBioRSS [1] and my own e-Biosphere Challenge: visualising biodiversity digitisation in real time. It was a time of enthusiasm for aggregating lots of data, such as the ill-fated PLoS Biodiversity Hub [2].

Since I seem to be condemned to revisit old ideas rather than come up with anything new, I've been looking at providing a tool like the now defunct uBioRSS. The idea is to harvest RSS feeds from journals (with an emphasis on taxonomic and systematic journals), aggregate the results, and make them browsable by taxon and geography. Here's a sneak peak:

What seems like a straightforward task quickly became a bit of a challenge. Not all journals have RSS feeds (they seem to have become less widely supported over time) so I need to think of alternative ways to get lists of recent articles. These lists also need to be processed in various ways. There are three versions of RSS, each with their own idiosyncracies, so I need to standardise things like dates. I also want to augment them with things like DOIs (often missing from RSS feeds) and thumbnails for the articles (often available on publisher websites but not the feeds). Then I need to index the content by taxon and geography. For taxa I use a version of Patrick Leary's "taxonfinder" (see https://right-frill.glitch.me) to find names, then the Global Names Index to assign names found to the GBIF taxonomic hierarchy.

Indexing by geography proved harder. Typically geoparsing involves taking a body of text and doing the following:

  • Using named-entity recognition NER to identity named entities in the text (e.g., place names, people names, etc.).
  • Using a gazetteer of geographic names GeoNames to try and match the place names found by NER.

An example of such a parser is the Edinburgh Geoparser. Typically geoparsing software can be large and tricky to install, especially if you are looking to make your installation publicly accessible. Geoparsing services seem to have a short half-life (e.g., Geoparser.io), perhaps because they are so useful they quickly get swamped by users.

Bearing this in mind, the approach I’ve taken here is to create a very simple geoparser that is focussed on fairly large areas, especially those relevant to biodiversity, and is aimed at geoparsing text such as abstracts of scientific papers. I've created a small database of places by harvesting data from Wikidata, then I use the "flash text" algorithm [3] to find geographic places. This approach uses a trie to store the place names. All I do is walk through the text seeing whether the current word matches a place name (or the start of one) in the trie, then moving on. This is very quick and seems to work quite well.

Given that I need to aggregate data from a lot of sources, apply various transformations to that data, then merge it, there are a lot of moving parts. I started playing with a "NoCode" platform for creating workflows, in this case n8n (in many ways reminiscent of the now defunct Yahoo Pipes). This was quite fun for a while, but after lots of experimentation I moved back to writing code to aggregate the data into a CouchDB database. CouchDB is one of the NoSQL databases that I really like as it has a great interface, and makes queries very easy to do once you get your head around how it works.

So the end result of this is "BioRSS" https://biorss.herokuapp.com. The interface comprises a stream of articles listed from newest to oldest, with a treemap and a geographic map on the left. You can use these to filter the articles by taxonomic group and/or country. For example the screen shot is showing arthropods from China (in this case from a month or two ago in the journal ZooKeys). As much fun as the interface has been to construct, in many ways I don't really want to spend time making an interface. For each combination of taxon and country I provide a RSS feed so if you have a favour feed reader you can grab the feed and view it there. As BioRSS updates the data your feed reader should automatically update the feed. This means that you can have a feed that monitors, say, new papers on spiders in China.

In the spirit of "release early and release often" this is an early version of this app. I need to add a lot more feeds, back date them to bring in older content, and I also want to make use of aggregators such as PubMed, CrossRef, and Google Scholar. The existence of these tools is, I suspect, one reason why RSS feeds are less common than they used to be.

So, if this sounds useful please take it for a spin at https://biorss.herokuapp.com. Feedback is welcome, especially suggestions for journals to harvest and add to the news feed. Ultimately I'd like to have sufficient coverage of the taxonomic literature so that BioRSS becomes a place where we can go to find the latest papers on any taxon of interest.

References

1. Patrick R. Leary, David P. Remsen, Catherine N. Norton, David J. Patterson, Indra Neil Sarkar, uBioRSS: Tracking taxonomic literature using RSS, Bioinformatics, Volume 23, Issue 11, June 2007, Pages 1434–1436, https://doi.org/10.1093/bioinformatics/btm109
2. Mindell, D. P., Fisher, B. L., Roopnarine, P., Eisen, J., Mace, G. M., Page, R. D. M., & Pyle, R. L. (2011). Aggregating, Tagging and Integrating Biodiversity Research. PLoS ONE, 6(8), e19491. doi:10.1371/journal.pone.0019491
3. Singh, V. (2017). Replace or Retrieve Keywords In Documents at Scale. CoRR, abs/1711.00046. http://arxiv.org/abs/1711.00046

Monday, April 28, 2008

Google Code wiki using Subversion

For some time now Google Code has been displaying the message:

The web interface for wiki content is currently READ-ONLY for maintenance.
You may still add comments, and members may add, edit, or delete wiki pages via svn. Learn more.

This is a bit of a pain as I've recently put the code for my LSID tester into Google Code (the project is here). Since having a simple wiki is part of the attraction of Google Code, I decided to finally figure out how to add a wiki via Subversion. Turns out it is pretty straight forward. I created a folder called "wiki" and added a file with some wiki markup. I then added it to the repository
svn import -m "Trying to add wiki"
wiki https://lsid-php.googlecode.com/svn/wiki/
--username USERNAME

(do this from the folder containing "wiki", not within the "wiki" folder itself). This adds the contents of the wiki folder to the Google Code repository. You can then check this out:
svn checkout
https://lsid-php.googlecode.com/svn/wiki/
lsid-php-wiki --username USERNAME

This probably seems obvious to many, but I'm used to CVS, having run a CVS repository since the late 1990's when Mike Charleston and I were working on TreeMap. I've been resisting moving to Subversion simply because of the hassle of learning stuff that doesn't actually make my life any easier. That said, Google Code is a nice way to host projects.

Thursday, February 03, 2011

Web Hooks and OpenURL: making databases editable

For me one of the most frustrating things about online databases is that they often can't be edited. For example, I've recently created a version of the Australian Faunal Directory on CouchDB, which contains a list of all animals in Australia, and a fairly comprehensive bibliography of taxonomic publication on those animals. What I'd like to do is locate those publications online. Using various scripts I've found DOIs for some 2,500 articles, and located nearly 4,900 article in BHL, and added these to the database, but browsing the database (using, say, the quantum treemap interface) makes it clear there are lots of publications that I've missed.

It would be great if I could go to the Australian Faunal Directory on CouchDB and edit these on that site, but that would require making the data editable, and that means adding a user interface. And that's potentially a lot of work. Then, if I go to another database (say, my CouchDB version of the Catalogue of Life) and want to make that editable then I have to add an interface to that database as well. I could switch to using a wiki, which I've done for some projects (such as the NCBI to Wikipedia mapping), but wikis have their own issues (in particular, they don't easily support the kinds of queries I want to do).

There is, as they say, a third way: web hooks. I first came across web hooks when I discovered that Post-Commit Web Hooks in Google Code. The idea is you can create a web service that gets called every time you commit code to the Google Code repository. For example, each time you commit code you can call a web hook that uses the Twitter API to tweet details of what you just committed (I tried this for a while, until some of my Twitter followers got seriously pissed off by the volume of tweets this was generating).

What has this to do with making databases editable? Well, imagine the following scenario. A web page displays a publication, but no DOI. However, the web page embeds an OpenURL in the form of a COinS (in other words, a URL with key-value pairs describing the publication). If you use a tool such as the OpenURL Referrer in Firefox you can use an OpenURL resolver to find that publication. Examples of OpenURL resolvers include bioGUID and BioStor. Let's say you find the publication, and it has a DOI. How do you tell the database about this? Well, you can try and find an email address of someone running the database so you can send them the information, but this is a hassle. What if the OpenURL resolver that you used to find the DOI could automatically tell the source database that it's found the DOI? That's the idea behind web hooks.

I've started to experiment with this, and have most of the pieces working. Publication pages in Australian Faunal Directory on CouchDB have COinS that include two additional pieces of information: (1) the database identifier for the publication (in this case a UUID, in the hideously complex jargon of OpenURL this the "Referring Entity Identifier"), and (2) the URL of the web hook. The idea is that an OpenURL resolver can take the OpenURL and try and locate the article. If it succeeds it will call the web hook URL supplied by the database, tell it "hey, I've found this DOI for the publication with this database identifier". The database can then update its data, so the next time a user visits the page for that publication in the database, the user will see the DOI. This has the huge advantage over tools that just modify the web page on the fly, such as David Shorthouse's reference parser of persistence: the database itself is updated, not just the web page.

In order to make this work, all the database needs to do is have a web hook, namely a URL that accepts POST requests. The heavy lifting of searching for the publication, or enabling users to correct and edit the data can be devolved to a single place, namely the OpenURL resolver. As a first step I'm building an OpenURL resolver that displays a form the in which the user can edit bibliographic details, and launch searches in CrossRef (and soon BioStor). When the user is done they can close the form, which is when it calls the web hook with the edited data. The database can then choose to accept or reject the update.

Given that it's easy to create the web hook, and trivial to get a database to output an OpenURL with its internal identifier and the URL of the web hook, this seems like a light-weight way of making databases editable.

Wednesday, November 26, 2008

Sequencing Carmen Electra


One byproduct of playing with the Challenge Demo is that I come across some rather surprising results. For example, the rather staidly titled "Cryptic speciation and paraphyly in the cosmopolitan bryozoan Electra pilosa—Impact of the Tethys closing on species evolution" (doi:10.1016/j.ympev.2007.07.016) starts to look a whole lot more interesting given the taxon treemap (right).

The girl is Carmen Electra, which is understandable given the Yahoo image search was for "Electra" (a genus of bryozoan). However, what are the wild men (and women) doing at the top? Turns out this is the result of searching for the genus Homo. But why, you ask, does a paper on bryozoans have human sequences? Well, looks like the table in the paper has incorrect GenBank accession numbers. The sequences AJ711044-50 should, I'm guessing, be AJ971044-50.

Ironically, although it was Carmen Electra's photo that initially made me wonder what was going on, it's really the hairy folks above her image that signal something is wrong. I've come across at least one other example of a paper citing an incorrect sequences, so it might be time to automate this checking. Or, what is probably going to be more fun, looking at treemaps for obviously wrong images and trying to figure out why.