Monday, January 25, 2016

iSpecies is back: mashing up species data

A decade ago (OMG, that can't be right, an actual decade ago) I created "iSpecies", a simple little tool to mashup a variety of data from GBIF, NCBI, Yahoo, Wikipedia, and Google Scholar to create a search engine for species. It was written in PHP, relied on some degree of *cough* web scraping to get its data, and was a bit of a toy (although that didn't stop me complaining that it could do more than EOL at the time). Eventually I got sick of dealing with Google Scholar constantly changing it's HTML and blocking IP addresses to stop people harvesting data (I once managed to get my entire campus blocked), or services disappearing such as Yahoo's image search, and I eventually pulled the plug on it.

A short course I run on "phyloinformatics" starts this week and one of the examples I show is a crude Javascript-based mashup. It struck me that I could tweak that and recreate a simple version of iSpecies, and that's exactly what I've done: http://ispecies.org.

Ispecies

It's nothing fancy, just takes a species name and searches GBIF, EOL, CrossRef, and Open Tree of Life, grabs some data and puts it together on a web page. There are lots of limitations (e.g., only fetches the first 300 localities in GBIF, requires scientific names, tree viewer is pretty awful) but it was pretty simple to put together. It's entirely client-side based, the code is all in the HTML file (and a few Javascript libraries) (the code is on GitHub: https://github.com/rdmpage/ispecies).

Fun as this was, there's a bigger problem with iSpecies and that's that it is a "mashup". I'm simply grabbing data from different sources and redisplaying it. What I really want is what has been described as a "mashup" (awful term, don't use it), that is, I want to combine the data so that it is more than the sum of its parts. For example, some of the data could be cross linked (especially if add a few more sources and we drill down a bit). Some of the papers discovered by CrossRef may include original descriptions, or may be the source of some of the points plotted on the GBIF map. Some may include the phylogenies used to build the Open Tree of Life tree. In order to build a data mashup instead of a web mashup we need to operate at the level of data rather than just human-readable web pages. That is the next thing I'd like to work on, and in many ways it shouldn't be a big leap. The new iSpecies was fairly easy to create because we now have a bunch of web services that all speak JSON. It's a small step from JSON to JSON-LD (especially if the JSON-LD is constructed with reuse in mind). So while it's nice to see iSpecies back, there's a much more interesting next step to think about.

Wednesday, January 13, 2016

Surfacing the deep data of taxonomy

My paper "Surfacing the deep data of taxonomy" (based on a presentation I gave in 2011) has appeared in print as part to a special issue of Zookeys:

Page, R. (2016, January 7). Surfacing the deep data of taxonomy. ZooKeys. Pensoft Publishers. http://doi.org/10.3897/zookeys.550.9293
The manuscript was written shortly after the talk, but as is the nature of edited volumes it's taken a while to appear.

My tweet about the paper sparked some interesting comments from David Shorthouse.

This is an appealing vision, because it seems unlikely that having multiple, small communities clustered around taxa will ever have the impact that taxonomists might like to have. Perhaps if we switch to focussing on objects (sequences, specimens, papers), notions of identity (e.g., DOIs, ORCID), and alternative measures of impact we can increase the visibility and perceived importance of the field. In this context, the recent paper "Wikiometrics: A Wikipedia Based Ranking System" http://arxiv.org/abs/1601.01058 looks interesting. A big consideration will be how connected is the network connecting taxonomists, papers, sequences, specimens, and names. If it's anything like the network of readers in Mendeley then we may face some challenges in community building around such a network.

Thursday, December 17, 2015

Will JSON, NoSQL, and graph databases save the Semantic Web?

OK, so the title is pure click bait, but here's the thing. It seems to me that the Semantic Web as classically conceived (RDF/XML, SPARQL, triple stores) has had relatively little impact outside academia, whereas other technologies such as JSON, NoSQL (e.g., MongoDB, CouchDB) and graph databases (e.g., Neo4J) have got a lot of developer mindshare.

In biodiversity informatics the Semantic Web has been a round for a while. We've been pumping out millions of RDF documents (mostly served by LSIDs) since 2005 and, to a first approximation, nothing has happened. I've repeatedly blogged about why I think this is (see this post for a summary).

I was an early fan of RDF and the Semantic Web, but soon decided that it was far more hassle than it was worth. The obsession with ontologies, the problems of globally unique identifiers based on HTTP (http-14 range, anyone?), the need to get a lot of ducks in a row all mad it a colossal pain. Then I discovered the NoSQL document database CouchDB, which is a JSON store that features map-reduce views rather than on the fly queries. To somebody with a relational database background this is a bit of a headfuck:

Fault tolerance

But CouchDB has a great interface, can be replicated to the cloud, and is FUN (how many times can you say that about a database?). So I starting playing with CouchDB for small projects, then used it to build BioNames and more recently moved BioStor to CouchDB hosted both locally and in the cloud.

Then there are graph databases such as Neo4J, which has some really cool things such as GraphGists which is a playground where you can create interactive graphs and query them (here's an example I created). Once again, this is FUN.

Another big trend over the last decade is the flight from XML and its hideous complexities (albeit coupled with great power) to the simplicity of JSON (part of the rise of JavaScript). JSON makes it very easy to pass around data in simple key-value documents (with more complexity such as lists if you need them). Pretty much any modern API will serve you data in JSON.

So, what happened to RDF? Well, along with a plethora of formats (XML, triples, quads, etc., etc.) it adopted JSON in the form of JSON-LD (see JSON-LD and Why I Hate the Semantic Web for background). JSON-LD lets you have data in JSON (which both people and machines find easy to understand) and all the complexity/clarity of having the data clearly labelled using controlled vocabularies such as Dublin Core and schema.org. This complexity is shunted off into a "@context" variable where it can in many cases be safely ignored.

But what I find really interesting is that instead of JSON-LD being a way to get developers interested in the rest of the Semantic Web stack (e.g. HTTP URIs as identifiers, SPARQL, and triple stores), it seems that what it is really going to do is enable well-described structured to get access to all the cool things being developed around JSON. For example, we have document databases such as CouchDB which speaks HTTP and JSON, and search servers such as ElasticSearch which make it easy to work with large datasets. There are also some cool things happening with graph databases and Javascript, such as Hexastore (see also Weiss, C., Karras, P., & Bernstein, A. (2008, August 1). Hexastore. Proc. VLDB Endow. VLDB Endowment. http://doi.org/10.14778/1453856.1453965, PDF here) where we create the six possible indexes of the classic RDF [subject,predicate,object] triple (this is the sort of thing can also be done in CouchDB). Hence we can have graph databases implemented in a web browser!

So, when we see large-scale "Semantic Web" applications that actually exist and solve real problems, we may well be more likely to see technologies other than the classic Semantic Web stack. As an example, see the following paper:

Szekely, P., Knoblock, C. A., Slepicka, J., Philpot, A., Singh, A., Yin, C., … Ferreira, L. (2015). Building and Using a Knowledge Graph to Combat Human Trafficking. The Semantic Web - ISWC 2015. Springer Science + Business Media. http://doi.org/10.1007/978-3-319-25010-6_12

There's a free PDF here, and a talk online. The consortium behind this project researchers did extensive text mining, data cleaning and linking, creating a massive collection of JSON-LD documents. Rather than use a triple store and SPARQL, they indexed the JSON-LD using ElasticSearch (notice that they generated graphs for each of the entities they care about, in a sense denormalising the data).

I think this is likely to be the direction many large-scale projects are going to be going. Use the Semantic Web ideas of explicit vocabularies with HTTP URIs for definitions, encode the data in JSON-LD so it's readable by developers (no developers, no projects), then use some of the powerful (and fun) technologies that have been developed around semi-structured data. And if you have JSON-LD, then you get SEO for free by embedding that JSON-LD in your web pages.

In summary, if biodiversity informatics wants to play with the Semantic Web/linked data then it seems obvious that some combination of JSON-LD with NoSQL, graph databases, and search tools like ElasticSearch are the way to go.

Wednesday, December 09, 2015

Visualising the difference between two taxonomic classifications

It's a nice feeling when work that one did ages ago seems relevant again. Markus Döring has been working on a new backbone classification of all the species which occur in taxonomic checklists harvested by GBIF. After building a new classification the obvious question arises "how does this compare to the previous GBIF classification?" A simple question, answering it however is a little tricky. It's relatively easy to compare two text files -- and this function appears in places such as Wikipedia and GitHub -- but comparing trees is a little trickier. Ordering in trees is less meaningful than in text files, which have a single linear order. In other words, as text strings "(a,b,c)" and "(c,b,a)" are different, but as trees they are the same.

Classifications can be modelled as a particular kind of tree where (unlike, say, phylogenies) every node has a unique label. For example, the tips may be species and the internal nodes may be higher taxa such as genera, families, etc. So, what we need is a way of comparing two rooted, labelled trees and finding the differences. Turns out, this is exactly what Gabriel Valiente and I worked on in this paper doi:10.1186/1471-2105-6-208. The code for that paper (available on GitHub) computes an "edit script" that gives a set of operations to convert one fully labelled tree into another. So I brushed up my rusty C++ skills (I'm using "skills" loosely here) and wrote some code to take two trees and the edit script, and create a simple web page that shows the two trees and their differences. Below is a screen shot showing a comparison between the classification of whales in the Mammals Species of the World, and one from GBIF (you can see a live version here).

Treediff

The display uses colours to show whether a nodes has been deleted from the first tree, inserted into the second tree, or moved to a different position. Clicking on a node in one tree scrolls the corresponding node in the other tree (if it exists) to scroll into view. Most of the differences between the two trees are due to the absence of fossils from Mammals Species of the World, but there are other issues such as GBIF ignoring tribes, and a few taxa that are duplicated due to spelling typos, etc.

Tuesday, December 01, 2015

Frontiers of biodiversity informatics and modelling species distributions #GBIFfrontiers @AMNH videos

For those of you who, like me, weren't at the "Frontiers Of Biodiversity Informatics and Modelling Species Distributions" held at the AMNH in New York, here are the videos of the talks and panel discussion, which the organisers have kindly put up on Vimeo with the following description:

The Center for Biodiversity and Conservation (CBC) partnered with the Global Biodiversity Information Facility (GBIF) to host a special "Symposium and Panel Discussion: Frontiers Of Biodiversity Informatics and Modelling Species Distributions" at the American Museum of Natural History on November 4, 2015.

The event kicked off a working meeting of the GBIF Task Group on Data Fitness for Use in Distribution Modelling at the City College of New York on November 5-6. GBIF convened the Task Group to assess the state of the art in the field, to connect with the worldwide scientific and modelling communities, and to share a vision of how GBIF support them in the coming decade.

The event successfully convened a broad, global audience of students and scientists to exchange ideas and visions on emerging frontiers of biodiversity informatics. Using inputs from the symposium and from a web survey of experts, the Data Fitness task group will prepare a report, which will be open for consultation and feedback at GBIF.org and on the GBIF Community Site in December 2015.

Guest post: 10 years of global biodiversity databases: are we there yet?

YtNkVT2UThis guest post by Tony Rees explores some of the themes from his recent talk 10 years of Global Biodiversity Databases: Are We There Yet?.

A couple of months ago I received an invitation to address the upcoming 2015 meeting of the Malacological Society of Australasia (Australian and New Zealand mollusc persons for the uninitiated) on some topic associated with biodiversity databases, and I decided that a decadal review might be an interesting exercise, both for my potential audience (perhaps) and for my own interest (definitely). Well, the talk is delivered and the slides are available on the web for viewing if interested, and Rod has kindly invited me to present some of its findings here, and possibly stimulate some ongoing discussion since a lot of my interests overlap his own quite closely. I was also somewhat influenced in my choice of title by a previous presentation of Rod's from some 5 years back, "Why aren't we there yet?" which provides a slightly pessimistic counterpoint to my own perhaps more optimistic summary.

I decided to construct the talk around 5 areas: compilations of taxonomic names and associated valid/accepted taxa; links to the literature (original citations, descriptions, more); machine-addressable lists of taxon traits; compilations of georeferenced species data points such as OBIS and GBIF; and synoptic efforts in the environmental niche modelling area (all or many species so as to be able to produce global biodiversity as well as single-species maps). Without recapping the entire content of my talk (which you can find on SlideShare), I thought I would share with readers of this blog some of the more interesting conclusions, many of which are not readily available elsewhere, at least not with effort to chase down and/or make educated guesses.

In the area of taxonomic names, for animals (sensu lato) ION has gone up from 1.8m to 5.2m names (2.8m to 3.5m indexed documents) from all ranks (synonyms not distinguished) over the cited period 2005-2015, while Catalogue of Life has gone up from 0.5m species names + ?? synonyms to 1.6m species names + 1.3m synonyms over the same period; for fossils, BioNames database is making some progress in linking ION names to external resources on the web but, at less than 100k such links, is still relatively small scale and without more than a single-operator level of resourcing. A couple of other "open access" biological literature indexing activities are still at a modest level (e.g. 250k-350k citations, as against an estimated biological literature of perhaps 20m items) at present, and showing few signs of current active development (unless I have missed them of course).

Comprehensive databases of taxon traits (in machine addressable form) appear to have started with the author’s own "IRMNG" genus- and species- level compendium which was initially tailored to OBIS needs for simply differentiating organisms into extant vs. fossil, marine vs. nonmarine. More comprehensive indexes exist for specific groups and recently, Encyclopedia of Life has established "TraitBank" which is making some headway although some of the "traits" such as geographic distribution (a bounding box from either GBIF or OBIS) and "number of GenBank sequences" stretch the concept of trait a little (just my two cents' worth, of course), and the newly created linkage to Google searches is to be applauded.

With regard to aggregating georeferenced species data (specimens and observations), both OBIS (marine taxa only) and GBIF (all taxa) have made quite a lot of progress over the past ten years, OBIS increasing its data holdings ninefold from 5.6m to 44.9m (from 38 to 1,900+ data providers) and GBIF more than tenfold from 45m to 577m records over the same period, from 300+ to over 15k providers. While these figures look healthy there are still many data gaps in holdings e.g. by location sampled, year/season, ocean depth, distance to land etc. and it is probably a fair question to ask what is the real "end point" for such projects, i.e. somewhere between "a record for every species" and "a record for every individual of every species", perhaps...

Global / synoptic niche modelling projects known to the author basically comprise Lifemapper for terrestrial species and AquaMaps for marine taxa (plus some freshwater). Lifemapper claims "data for over 100,000 species" but it is unclear whether this corresponds to the number of completed range maps available at this time, while AquaMaps has maps for over 22,000 species (fishes, marine mammals and invertebrates, with an emphasis on fishes) each of which has a point data map, a native range map clipped to where the species is believed to occur, an "all suitable habitat map" (the same unclipped) and a "year 2100 map" showing projected range changes under one global warming scenario. Mapping parameters can also be adjusted by the user using an interactive "create your own map" function, and stacking all completed maps together produces plots of computed ocean biodiversity plus the ability to undertake web-based "what [probably] lives here" queries for either all species or for particular groups. Between these two projects (which admittedly use different modelling methodologies but both should produce useful results as a first pass) the state of synoptic taxon modelling actually appears quite good, especially since there are ongoing workshops e.g. the recent AMNH/GBIF workshop Biodiversity Informatics and Modelling Species Distributions at which further progress and stumbling blocks can be discussed.

So, some questions arising:

  • Who might produce the best "single source" compendium of expert-reviewed species lists, for all taxa, extant and fossil, and how might this happen (my guess: a consortium of Catalogue of Life + PaleoBioDB at some future point)
  • Will this contain links to the literature, at least citations but preferably as online digital documents where available? (CoL presently no, PaleoBioDB has human-readable citations only at present)
  • Will EOL increasingly claim the "TraitBank" space, and do a good enough job of it? (also bearing in mind that EOL is still an aggregator, not an original content creator, i.e. somebody still has to create it elsewhere)
  • Will OBIS and/or GBIF ever be "complete", and how will we know when we’ve got there (or, how complete is enough for what users might require)?
  • Same for niche modelling/predicted species maps: will all taxa eventually be covered, and will the results be (generally) reliable and useable (and at what scale); or, what more needs to be done to increase map quality and reliability.

Opinions, other insights welcome!

Wednesday, November 18, 2015

Comments on "Widespread mistaken identity in tropical plant collections"

Zoë A. Goodwin (@Drypetes) and collegagues have published a paper with a title guaranteed to get noticed:

Goodwin, Z. A., Harris, D. J., Filer, D., Wood, J. R. I., & Scotland, R. W. (2015, November). Widespread mistaken identity in tropical plant collections. Current Biology. Elsevier BV. http://doi.org/10.1016/j.cub.2015.10.002http://doi.org/10.1016/j.cub.2015.10.002

Their paper argues that "more than half of all tropical plant collections may be wrongly named." This is clearly a worrying conclusion with major implications for aggregators such as GBIF that get the bulk of their data (excluding birds) from museums and herbaria.

I'm quite prepared to accept that there are going to be considerable problems with herbarium and museum labels, but there are aspects of this study that are deeply frustrating.

Where's the data?

The authors don't provide any data! This difficult to understand, especially as they downloaded data from GBIF which provides DOIs for each and every download. Why don't the authors cite those DOIs (which would enable others to grab the same data, and also ultimately provides a way to provide credit to the original data providers)? The authors obtained data from multiple herbaria, matched specimens that were the same, and compared their taxonomic names. This is a potentially very useful data set, but the authors don't provide it. Anybody wanting to explore the problem immediately hits a brick wall.

Unpublished taxonomy

The first group of plants the authors looked at is Aframomum, and they often refer to a recent monograph of this genus which is cited as "Harris, D.J., and Wortley, A.H. (In Press). Monograph of Aframomum (Zingiberaceae). Syst. Bot. Monogr.". As far as I can tell, this hasn't been published. This not only makes it hard for the reader to investigate further, it means the authors mention a name in the paper that doesn't seem to be have been published:
In 2014 the plant was recognized as a new species, Aframomum lutarium D.J.Harris & Wortley, by Harris & Wortley as part of the revision of the genus Aframomum
I confess ignorance of the Botanical Code of Nomenclature, but in zoology this is a no no.

What specimen is show in Fig. 1?

Gr1 lrg Figure 1 shows a herbarium specimen, but there's no identifier or link for the specimen. Is this specimen available online? Can I see it in GBIF? Can I see it's history and explore further? if not, why not? If it's not available online, why not pick one that is?

What is "wrong"?

The authors state:
Examination of the 560 Ipomoea names associated with 49,500 specimens in GBIF (Figure S1A) revealed a large proportion of the names to be nomenclatural and taxonomic synonyms (40%), invalid, erroneous or unrecognised names (16%, ‘invalid’ in Figure S1A). In addition, 11% of the specimens in GBIF were unidentified to species.
Are synonyms wrong? If it's a nomenclatural synonym, then it's effectively the same name. If it's a taxonomic synonym, then is that "wrong"? Identifications occur at a given time, and our notion of what constitutes a taxon can change over time. It's one thing to say a specimen has been assigned to a taxon which we now regard as a synonym of another, quite another to say that a specimen has been wrongly identified. What are "invalid, erroneous or unrecognised names"? Are these typos, or genuinely erroneous names? Once again, if the authors provided the data we could investigate. But they haven't, so we can't examine whether their definition of "wrong" is reasonable.

I'm all for people flagging problems (after all, I've made something of career of it), but surely one reason for flagging problems is so that they can be recognised and fixed. By basing their results on an unpublished monograph, and by not providing any data in support of their conclusions, the authors prevent those of us interested in fixing problems being able to drill down and understand the nature of the problem. If the authors had both published the article and provided the data they would have done the community a real service. Instead we are left with a study with a click bait title that will get lots of attention, but which doesn't provide any way for people to make progress on the problem the paper identifies.

Wednesday, September 23, 2015

Visualising big phylogenies (yet again)

Inspired in part by the release of the draft tree of life (doi:10.1073/pnas.1423041112 by the Open Tree of Life, I've been revisiting (yet again) ways to visualise very big phylogenies (see Very large phylogeny viewer for my last attempt).

My latest experiment uses Google Maps to render a large tree. Googletree Google Maps uses "tiles" to create a zoomable interface, so we need to create tiles for different zoom levels for the phylogeny. To create this visualisation I did the following:

  1. The phylogeny laid out in a 256 x 256 grid.
  2. The position of each line in the drawing is stored in a MySQL database as a spatial element (in this case a LINESTRING)
  3. When the Google Maps interface needs to display a tile at a certain zoom level and location, a spatial SQL query retrieves the lines that intersect the bounds of the tile, then draws those using SVG.
Hence, the tiles are drawn on the fly, rather than stored as images on disk. This is a crude proof of concept so far, there are a few issues to tackle to make this usable:
  1. At the moment there are no labels. I would need a way to compute what tables to show at what zoom level ("level of detail"). In other words, at low levels of zoom we want just a few higher taxa to be picked out, whereas as we zoom in we want more and more taxa to be labelled, until at the highest zoom levels we have the tips individually labelled.
  2. Ideally each tile would require roughly the same amount of effort to draw. However, at the moment the code is very crude and simply draws every line that intersects a tile. For example, for zoom level 0 the entire tree fits on a single tile, so I draw the entire tree. This is not going to scale to very large trees, so I need to be able to "cull" a lot of the lines and draw only those that will be visible.
In the past I've steered away from Google Maps-style interfaces because the image is zoomed along both the x and y axes, which is not necessarily ideal. But the tradeoff is that I don't have to do any work handling user interactions, I just need to focus on efficiently rendering the image tiles.

All very crude, but I think this approach has potential, especially if the "level of detail" issue can be tackled.

Friday, September 18, 2015

Towards an interactive web-based phylogeny editor (à la MacClade)

Currently in classes where I teach the basics of tree building, we still fire up ancient iMacs, load up MacClade, and let the students have a play. Typically we give them the same data set and have a class competition to see which group can get the shortest tree by manually rearranging the branches. It’s fun, but the computers are old, and what’s nostalgic for me seems alien to the iPhone generation.

One thing I’ve always wanted to have is a simple MacClade-like tree editor for the Web, where the aim is not so much character analysis as teaching the basics of tree building. Something with the easy of use as Phylo (basically Candy Crush for sequence alignments).

Slide

The challenge is to keep things as simple as possible. One idea is to have a column of taxa and you can drag individual taxa up and down to rearrange the tree.

Interactive tree design notes

Imagine each row has the characters and their states. Unlike the Phylo game, where the goal is to slide the amino acids until you get a good aliognment, here we want to move the taxa to improve the tree (e.g., based on its parsimony score).

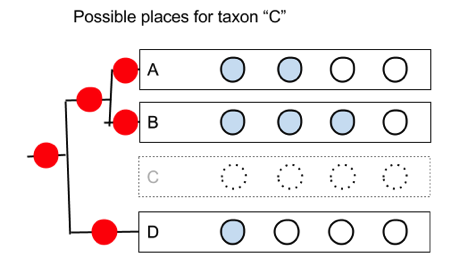
The problem is that we need to be able to generate all possible rearrangements for a given number of taxa. In the example above, if we move taxon C, there are five possible positions it could go on the remaining subtree:

2 But if we simply shuffle the order of the taxa we can’t generate all the trees. However, if we remember that we also have the internal nodes, then there is a simple way we can generate the trees. 1 When we draw a tree each row corresponds to a node. The gap between each pair of leaves (the taxa A,B,D) corresponds to the an internal nodes. So we could divide the drawing up into “hit zone”, so that if you drag the taxon we’re adding (“C”) onto the zone centred on a leaf, we add the taxon below that leaf; if we drag it onto a zone between two leaves, we attach it below that the corresponding internal node. From the user’s point of view they are still simply sliding taxa up and down, but in doing so we can create each of the possible trees.

We could implement this in a Web browser with some Javascript to handle the user moving the taxa, and draw the corresponding phylogeny to the left, and quickly update the (say, parsimony) score of the tree so that the user gets immediate feedback as to whether the rearrangement they’ve made improves the tree.

I think this could be a fun teaching tool, and if it supported touch then students could use their phones and tablets to get a sense of how tree building works.

Thursday, September 17, 2015

On having multiple DOI registration agencies for the same journal

On Friday I discovered that BHL has started issuing CrossRef DOIs for articles, starting with the journal Revue Suisse de Zoologie. The metadata for these articles comes from BioStor. After a WTF and WWIC moment, I tweeted about this, and something of a Twitter storm (and email storm) ensued:

To be clear, I'm very happy that BHL is finally assigning article-level DOIs, and that it is doing this via CrossRef. Readers of this blog may recall an earlier discussion about the relative merits of different types of DOIs, especially in the context of identifiers for articles. The bulk of the academic literature has DOIs issued by CrossRef, and these come with lots of nice services that make them a joy to use if you are a data aggregator, like me. There are other DOI registration agencies minting DOIs for articles, such as Airiti Library in Taiwan (e.g., doi:10.6165/tai.1998.43(2).150) and ISTIC (中文DOI) in China (e.g., doi:10.3969/j.issn.1000-7083.2014.05.020) (pro tip, if you want to find out the registration agency for a DOI, simply append it to http://doi.crossref.org/doiRA/, e.g. http://doi.crossref.org/doiRA/10.6165/tai.1998.43(2).150). These provide stable identifiers, but not the services needed to match existing bibliographic data to the corresponding DOI (as I discovered to my cost while working with IPNI).

However, now things get a little messy. From 2015 PDFs for Revue Suisse de Zoologie are being uploaded to Zenodo, and are getting DataCite DOIs there (e.g., doi:10.5281/zenodo.30012). This means that the most recent articles for this journal will not have CrossRef DOIs. From my perspective, this is a disappointing move. It removes the journal from the CrossRef ecosystem at a time when the uptake of CrossRef DOIs for taxonomic journals is at an all time high (both ZooKeys and Zootaxa have CrossRef DOIs), and now BHL is starting to issue CrossRef DOIs for the "legacy" literature (bear in mind that "legacy" in this context can mean articles published last year).

I've rehearsed the reasons why I think CrossRef DOIs are best elsewhere, but the keys points are that articles are much easier to discover (e.g., using http://search.crossref.org), and are automatically first class citizens of the academic literature. However, not everybody buys these arguments.

Maybe a way forward is to treat the two types of DOI as identifying two different things. The CrossRef DOI identifies the article, not a particular representation. The Zenodo DOI (or any DataCite DOI) for a PDF identifies that representation (i.e., the PDF), not the article.

Having CrossRef and Zenodo  DataCite DOIs coexist

This would enable CrossRef and Zenod DOIs to coexist, providing we can (a) have some way of describing the relationship between the two kinds of DOI (e.g., CrossRef DOI - hasRepresentation -> Zenodo DOI).

This would give freedom to those who want the biodiversity literature to be part of the wider CrossRef community to mint CrossRef DOIs to do so. It gives those articles the benefits that come with CrossRef DOIs (findability, being included in lists of literature cited, citation statistics, customer support when DOIs break, altmetrics, etc.)

It would also enable those who want to ensure stable access to the contents of the biodiversity literature to use archives such as Zenodo, and have the benefits of those DOIs (stability, altmetrics, free file storage and free DOIs).

Having multiple DOIs for the same thing is, I'd argue, at the very least, unhelpful. But if we tease apart the notion of what we are identifying, maybe they can coexist. Otherwise I think we are in danger of making choices that, while they seem locally optimal (e.g., free storage and minting of DOIs), may in the long run cause problems and run counter to the goal of making the taxonomic literature has findable as the wider literature.

Friday, September 11, 2015

Possible project: natural language queries, or answering "how many species are there?"

Google Google knows how many species there are. More significantly, it knows what I mean when I type in "how many species are there". Wouldn't it be nice to be able to do this with biodiversity databases? For example, how many species of insect are found in Fiji? How would you answer this question? I guess you'd Google it, looking for a paper. Or you'd look in vain on GBIF, and then end up hacking some API queries to process data and come up with an estimate. Why can't we just ask?

On the face of it, natural language queries are hard, but there's been a lot of work down in this area. Furthermore, there's a nice connection with the idea of knowledge graphs. One approach to natural language parsing is to convert a natural language query to a path in a knowledge graph (or, if you're Facebook, the social graph). Facebook has some nice posts describing how their graph search works (e.g., Under the Hood: Building out the infrastructure for Graph Search), and there's a paper describing some of the infrastructure (e.g., "Unicorn: a system for searching the social graph" doi:10.14778/2536222.2536239, get the PDF here).

Natural language queries can seem potentially unbounded, in the sense that the user could type in anything. But there are ways to constrain this, and ways to anticipate what the user is after. For example, Google suggests what you may be after, which gives us clues as to the sort of questions we'd need answers for. It would be a fun exercise to use Google suggest to discover what questions people are asking about biodiversity, then determine what would it take to be able to answer them.

Suggest All very sensible questions that existing biodiversity databases would struggle to answer.

There's a nice presentation by Kenny Bastani where he tackles the problem of bounding the set of possible questions by first generating the questions for which he answers, then caching those so that the user can select from them (using, for example, a type-ahead interface).

Hence, we could generate species counts for all major and/or charismatic taxa for each country, habitat type (or other meaningful category), then generate the corresponding query (e.g., "how many species of birds are there in Fiji", where the yellow and cyan" terms are the things we replace for each query).

One reason this topic appeals is that it is intimiately linked to the idea of a biodiversity knowledge graph, in that answers to a number of questions in biodiversity can be framed as paths in that graph. Do, if we build the graph we should also be asking about ways to query it. In particular, how do we answer the most basic questions of the information we are aggregating in myriad databases.

Monday, September 07, 2015

Wikidata, Wikipedia, and #wikisci

Last week I attended the Wikipedia Science Conference (hashtag: #wikisci) at the Wellcome Trust in London. it was an interesting two days of talks and discussion. Below are a few random notes on topics that caught my eye.

What is Wikidata?

A recurring theme was the emergence of Wikidata, although it never really seemed clear what role Wikidata saw for itself. On the one hand, it seems to have a clear purpose:
Wikidata acts as central storage for the structured data of its Wikimedia sister projects including Wikipedia, Wikivoyage, Wikisource, and others.
At other times there was a sense that Wikidata wanted to take any and all data, which it doesn't really seemed geared up to do. The English language Wikipedia has nearly 5 million articles, but there are lots of scientific databases that dwarf that in size (we have at least that many taxonomic names, for example). So, when Dario Taraborelli suggests building a repository of all citations with Wikidata, does he really mean ALL citations in the academic literature? CrossRef alone has 75M DOIs, whereas Wikidata currently has 14.8M pages, so we are talking about greatly expanding the size of Wikidata with just one type of data.

The sense I get is that Wikidata will have an important role in (a) structuring data in Wikipedia, and (b) providing tools for people to map their data to the equivalent topics in Wikipedia. Both are very useful goals. What I find less obvious is whether (and if so, how) Wikidata aims to be a more global database of facts.

How do you Snapchat? You just Snapchat

As a relative outsider to the Wikipedia community, and having had a sometimes troubled experience with Wikipedia, it struck me that how opaque things are if your are an outsider. I suspect this is true of most communities, if you are a member then things seem obvious, if you're not, it takes time to find out how things are done. Wikipedia is a community with nobody in charge, which is a strength, but can also be frustrating. The answer to pretty much any question about how to add data to Wikidata, how to add data types, etc. was "ask the community". I'm reminded of the American complaint about the European Union "if you pick up the phone to call Europe, who do you call?". In order to engage you have to invest time in discovering the relevant part of the community, and then learn engage with it. This can be time consuming, and is a different approach to either having to satisfy the requirements of gatekeepers, or a decentralised approach where you can simply upload whatever you want.

Streams

It seems that everything is becoming a stream. Once the volume of activity reaches a certain point, people don't talk about downloading static datasets, but instead of consuming a stream of data (very like the Twitter firehose). The volume of Wikipedia edits means scissile scientists studying the growth of Wikipedia are now consuming streams. Geoffrey Bilder of CrossRef showed some interesting visualisations of real-time streams of DOIs being as users edited Wikipedia pages CrossRef DOI Events for Wikimedia, and Peter Murray-Rust of ContentMine seemed to imply that ContentMine is going to generate streams of facts (rather than, say, a query able database of facts). Once we get to the stage of having large, transient volumes of data, all sorts of issues about reanalysis and reproducibility arise.

CrossRef and evidence

One of the other strking visualisations that CrossRef have is the DOI Chronograph, which displays the numbers of CrossRef DOI resolutions by the domain of the hosting web site. In other words, if you are on a Wikipedia page and click on a DOI for an article, that's recorded as a DOI resolution from the domain "wikipedia.org". For the period 1 October 2010 to 1 May 2015 Wikipedia was the source of 6.8 million clicks on DOIs, see http://chronograph.labs.crossref.org/domains/wikipedia.org. One way to interpret this is that it's a measure of how many people are accessing the primary literature - the underlying evidence - for assertions made on Wikipedia pages. We can compare this with results for, say, biodiversity informatics projects. For example, EOL has 585(!) DOI clicks for the period 15 October 2010 to 30 April 2015. There are all sorts of reasons for the difference between these two sites, such as Wikipedia has vastly more traffic than EOL. But I think it also reflects the fact that many Wikipedia articles are richly referenced with citations to the primary literature, and projects like EOL are very poorly linked to that literature. Indeed, most biodiversity databases are divorced from the evidence behind the data they display.

Diversity and a revolution led by greybeards

"Diversity" is one of those words that has become politicised, and attempts to promote "diversity" can get awkward ("let's hear from the women", that homogeneous category of non-men). But the aspect of diversity that struck me was age-related. In discussions that involved fellow academics, invariably they looked a lot like me - old(ish), relatively well-established and secure in their jobs (or post-job). This is a revolution led not by the young, but by the greybeards. That's a worry. Perhaps it's a reflection of the pressures on young or early-stage scientists to get papers into high-impact factor journals, get grants, and generally play the existing game, whereas exploring new modes of publishing, output, impact, and engagement have real risks and few tangible rewards if you haven't yet established yourself in academia.

Wednesday, September 02, 2015

Hypothes.is revisited: annotating articles in BioStor

YClX4 gV Over the weekend, out of the blue, Dan Whaley commented on an earlier blog post of mine (Altmetrics, Disqus, GBIF, JSTOR, and annotating biodiversity data. Dan is the project lead for hypothes.is, a tool to annotate web pages. I was a bit dismissive as hypothes.is falls into the "stick note" camp of annotation tools, which I've previously been critical of.

However, I decided to take another look at hypothes.is and it looks like a great fit to another annotation problem I have, namely augmenting and correcting OCR text in BioStor (and, by extension, BHL). For a subset of BioStor I've been able to add text to the page images, so you can select that text as you would on a web page or in a PDF with searchable text. If you can select text, you can annotate it using hypothes.is. Then I discovered that not only is hypothes.is a Chrome extension (which immediately limits who will use it), you can add it to any web site that you publish. So, as an experiment I've added it to BioStor, so that people can comment on BioStor using any modern browser.

So far, so good, but the problem is I'm relying on the "crowd" to come along and manually annotate the text. But I have code that can take text and extract geographic localities (e.g., latitude and longitude pairs), specimen does, and taxonomic names. What I'd really like to do is be able pre-process the text, locate these features, then programmatically add those as annotations. Who wants to do this manually when a computer can do most of it?

Hypothesi.is, it turns out, has an API that, while a bit *cough* skimpy on documentation, enables you to add annotations to text. So now I could pre-process the text, and just ask people to add things that have been missed, or flag errors on the automated annotations.

This is all still very preliminary, but as an example here's a screen shot of a page in BioStor together with geographic annotations displayed using hypothes.is (you can see this live here: http://biostor.org/reference/147608/page/1 (make sure you click on the widgets at the top right of the page to see the annotations):

Hypothesis

The page shows two point localities that have been extracted from the text, together with a static Google Map showing the localities (hypothesis.is supports Markdown in annotations, which enables links and images to be embedded).

Not only can we write annotations, we can also read them, so if someone adds an annotation (e.g., highlights a specimen code that was missed, or some text that OCR has messed up) we could retrieve that and, for example, index the corrected text to improve findability.

Lots still to do, but these early experiments are very encouraging.

Tuesday, September 01, 2015

Dark taxa, drones, and Dan Janzen: 6th International Barcode of Life Conference

6thBOL logo 300x237 A little over a week ago I was at the 6th International Barcode of Life Conference, held at Guelph, Canada. It was my first barcoding conference, and was quite an experience. Here are a few random thoughts.

Attendees

It was striking how diverse the conference crowd was. Apart from a few ageing systematists (including veterans of the cladistics wars), most people were young(ish), and from all over the world. There clearly something about the simplicity and low barrier to entry of barcoding that has enabled its widespread adoption. This also helps give barcoding a cohesion, no matter what the taxonomic group or the problem you are tackling, you are doing much the same thing as everybody else (but see below). While ageing systematists (like myself) may hold their noses regarding the use of a single, short DNA sequence and a tree-building method some would dismiss as "phenetic", in many ways the conference was a celebration of global-scale phylogeography.

Standards aren't enough

And yet, standards aren't enough. I think what contributes to DNA barcoding's success is that sequences are computable. If you have a barcode, there's already a bunch of barcodes sequences you can compare yours to. As others add barcodes, your sequences will be included in subsequent analyses, analyses which may help resolve the identity of what you sequenced.

To put this another way, we have standard image file formats, such as JPEG. This means you can send me a bunch of files, safe in the knowledge that because JPEG is a standard I will be able to open those files. But this doesn't mean that I can do anything useful with them. In fact, it's pretty hard to do anything with images part from look at them. But if you send me a bunch of DNA sequences for the same region, I can build a tree, BLAST GenBank for similar sequences, etc. Standards aren't enough by themselves, to get the explosive growth that we see in barcodes the thing you standardise on needs to be easy to work with, and have a computational infrastructure in place.

Next generation sequencing and the hacker culture

Classical DNA barcoding for animals uses a single, short mtDNA marker that people were sequencing a couple of decades ago. Technology has moved on, such that we're seeing papers such as An emergent science on the brink of irrelevance: a review of the past 8 years of DNA barcoding. As I've argued earlier (Is DNA barcoding dead?) this misses the point about the power of standardisation on a simple, scalable method.

At the same time, it was striking to see the diversity of sequencing methods being used in conference presentations. Barcoding is a broad church, and it seemed like it was a natural home for people interested in environmental DNA. There was excitement about technologies such as the Oxford Nanopore MinION™, with people eager to share tips and techniques. There's something of a hacker culture around sequencing (see also Biohackers gear up for genome editing), just as there is for computer hardware and software.

Community

The final session of the conference started with some community bonding, complete with Paul Hebert versus Quentin Wheeler wielding light sables. If, like me, you weren't a barcode, things started getting a little cult-like. But there's no doubt that Paul's achievement in promoting a simple approach to identifying organisms, and then translating that into a multi-million dollar, international endeavour is quite extraordinary.

After the community bonding, came a wonderful talk by Dan Janzen. The room was transfixed as Dan made the case for conservation, based on his own life experiences, including Area de Conservación Guanacaste where he and Winnie Hallwachs have been involved since the 1970s. I sat next to Dan at a dinner after the conference, and showed him iNaturalist, a great tool for documenting biodiversity with your phone. He was intrigued, and once we found pictures taken near his house in Costa Rica, he was able to identify the individual animals in the photos, such as a bird that has since been eaten by a snake.

Dark taxa

My own contribution to the conference was a riff on the notion of dark taxa, and mostly consisted of me trying think through how to respond to DNA barcoding. The three responses to barcoding that I came up with are:
  1. By comparison to barcoding, classical taxonomy is digitally almost invisible, with great chunks of the literature still not scanned or accessible. So, one response is to try and get the core data of taxonomy digitised and linked as fast as possible. This is why I built BioStor and BioNames, and why I continually rant about the state of efforts to digitise taxonomy.
  2. This is essentially President Obama's "bucket" approach, maybe the sane thing to do is see barcoding as the future and envisage what we could do in a sequence only world. This is not to argue that we should ignore the taxonomic literature as such, but rather lets start with sequences first and see what we can do. This is the motivation for my Displaying a million DNA barcodes on Google Maps using CouchDB, and my experiments with Visualising Geophylogenies in Web Maps Using GeoJSON. These barely scratch the surface of what can be done.
  3. The third approach is to explore how we integrate taxonomy and barcoding at global scale, in which case linking at specimen level (rather, than, say using taxonomic names) seems promising, albeit requiring a massive effort to reconcile multiple specimen identifiers.

Summary

Yes, the barcoding conference was that rare thing, a well organised (including well-fed), interesting, indeed eye-opening, conference.

Friday, August 14, 2015

Possible project: NameStream - a stream of new taxonomic names

Yet another barely thought out project, although this one has some crude code. If some 16,000 new taxonomic names are published each year, then that is roughly 40 per day. We don't have a single place that aggregates these, so any major biodiversity projects is by definition out of date. GBIF itself hasn't had an update list of fungi or plant names for several years, and at present doesn't have an up to date list of animal names. You just have to follow the Twitter feeds of ZooKeys and Zootaxa to feel swamped in new names.

And yet, most nomenclators are pumping out RSS feeds of new names, or have APIs that support time-based queries (i.e., send me the names added in the last month). Won't it be great to have a single aggregator that took these "name streams", augmented them by adding links to the literature (it could, for example, harvest RSS feeds and Twitter streams of the relevant journals), and provided the biodiversity community with a feed of new names and associated supporting information. We could watch new discoveries of new biodiversity unfold in near real time, as well as provide a stream of data for projects such as GBIF and others to ingest and keep their databases up to date.

Possible project: A PubMed Central for taxonomy

F93f2e30d1cca847800e6f3060b8101a I need more time to sketch this out fully, but I think a case can be made for a taxonomy-centric (or, perhaps more usefully, a biodiversity-centric) clone of PubMed Central.

Why? We already have PubMed Central, and a European version Europe PubMed Central, and the content of Open Access journals such as ZooKeys appears in both, so, again, why?

Here are some reasons:

  1. PubMed Central has pioneered the use of XML to archive and publish scientific articles, specifically JATS XML. But the biodiversity literature comes in all sorts of formats, including several flavours of XML (such as SciElo XML, XML from OCR literature such as DjVu, ABBYY, and TEI, etc.)
  2. While Europe PMC is doing nice things with ORCIDs and entity extraction, it doesn't deal with the kinds of entities prevalent in the taxonomic literature (such as geographic localities, specimen codes, micro citations, etc.). Nor does it deal with extracting the core scientific statements that a taxonomic paper makes.
  3. Given that much of the taxonomic literature will be derived from OCR we need mechanisms to be able to edit and fix OCR errors, as well as markup errors in more recent XML-native documents. For example, we could envisage having XML stored on GitHub and open to editing.
  4. We need to embed taxonomic literature in our major biodiversity databases, rather than have it consigned to ghettos of individual small-scale digitisation project, or swamped by biomedical literature whose funding and goals may not align well with the biodiversity community (Europe PMC is funded primary by medical bodies).
I hope to flesh this out a bit more later on, but I think it's time we started treating the taxonomic literature as a core resource that we, as a community, are responsible for. The NIH did this with biomedical research, shouldn't we be doing the same for biodiversity?

Monday, August 10, 2015

Demo of full-text indexing of BHL using CouchDB hosted by Cloudant

One of the limitations of the Biodiversity Heritage Library (BHL) is that, unlike say Google Books, its search functions are limited to searching metadata (e.g., book and article titles) and taxonomic names. It doesn't support full-text search, by which I mean you can't just type in the name of a locality, specimen code, or a phrase and expect to get back much in the way of results. In fact, in many cases when I Google a phrase that occurs in BHL content I'm more likely to find that phrase in content from the Internet Archive, and then it's a matter of following the links to the equivalent item in BHL.

So, as an experiment I've created a live demo of what full-text search in BHL could look like. I've done this using the same infrastructure the new BioStor is built on, namely CouchDB hosted by Cloudant. Using BHL's API I've grabbed some volumes of the British Ornithological Club's Bulletin and put them into CouchDB (BHL's API serves up JSON, so this is pretty straightforward to do). I've added the OCR text for each page, and asked Cloudant to index that. This means that we can now search on a phrase in BHL (in the British Ornithological Club's Bulletin) and get a result.

I've made a quick and dirty demo of this approach and you can see it in the "Labs" section on BioStor, so you can try it here. You should see something like this:

Bhl couchdb The page image only appears if you click on the blue labels for the page. None of this is robust or optimised, but it is a workable proof-of-concept of how fill-text search could work.

What could we do with this? Well, all sorts of searches are no possible. We can search for museum specimen codes, such as 1900.2.27.13. This specimen is in GBIF (see http://bionames.org/~rpage/material-examined/www/?code=BMNH%201900.2.27.13) so we could imagine starting to link specimens to the scientific literature about that specimen. We can also search for locations (such as Mt. Albert Edward), or common names (such as crocodile).

Note that I've not completed uploading all the page text and XML. Once I do I'll have a better idea of how scalable this approach is. But the idea of having full-text search across all of BHL (or, at least the core taxonomic journals) is tantalising.

Technical details

Initially I simply displayed a list of the pages that matched the search term, together with a fragment of text with the search term highlighted. Cloudant's version of CouchDB provides these highlights, and a "group_field" that enabled me to group together pages from the same BHL "item" (roughly corresponding to a volume of a journal).

This was a nice start, but I really wanted to display the hits on the actual BHL page. To do this I grabbed the DjVu XML for each BHL page for British Ornithological Club's Bulletin, and used a XSLT style-sheet that renders the OCR text on top of the page image. You can't see the text because it I set the colour of the text to "rgba(0, 0, 0, 0)" (see http://stackoverflow.com/a/10835846) and set the "overflow" style to "hidden". But the text is there, which means you can select with the mouse and copy and paste it. This still leaves the problem of highlighting the text that matches the search term. I originally wrote the code for this to handle species names, which comprise two words. So, each DIV in the HTML has a "data-one-word" and "data-two-words" attribute set, which contains the first (and forst plus second) word in the search term, respectively. I then use a JQuery selector to set the CSS of each DIV that has a "data-one-word" or "data-two-words" attribute that matches the search term(s). Obviously, this is terribly crude, and doesn't do well if you've more than two word sin your search query.

As an added feature, I use CSS to convert the BHL page scan to a black-and-white image (works in Webkit-based browsers).

Possible project: mapping authors to Wikipedia entries using lists of published works

220px Boulenger George 1858 1937One of the less glamorous but necessary tasks of data cleaning is mapping "strings to things", that is, taking strings such as "George A. Boulenger" and mapping them to identifiers, such as ISNI: 0000 0001 0888 841X. In case of authors such as George Boulenger, one way to do this would be through Wikipedia, which has entries for many scientists, often linked to identifiers for those people (see the bottom of the Wikipedia page for George A. Boulenger and look at the "Authority Control" section).

How could we make these mappings? Simple string matching is one approach, but it seems to me that a more robust approach could use bibliographic data. For example, if I search for George A. Boulenger in BioStor, I get lots of publications. If at least some of these were listed on the Wikipedia page for this person, together with links back to BioStor (or some other external identifier, such as DOIs), then we could do the following:

  1. Search Wikipedia for names that matched the author name of interest
  2. If one or more matches are found, grab the text of the Wikipedia pages, extract any literature cited (e.g., in the {cite} tag), get the bibliographic identifiers, and see if they match any in our search results.
  3. If we get one or more hits, then it's likely that the Wikipedia page is about the author of the papers we are looking at, and so we link to it.
  4. Once we have a link to Wikipedia, extract any external identifier for that person, such as ISNI or ORCID.
For this to work, it requires that the Wikipedia page cites works by the author in a way that we can harvest, and uses identifiers that we can match to those in the relevant database (e.g., BioStor, Crossef, etc.). We might also have to look at Wikipedia pages in multiple languages, given that English-language Wikipedia may be lacking information on scholars from non-English speaking countries (this will be a significant issue for many early taxonomists).

Based on my limited browsing of Wikipedia, there seems to be little standardisation of entries for people, certainly little in how their published works are listed (the section heading, format, how many, etc.). The project I'm proposing would benefit from a consistent set of guidelines for how to include a scholar's output.

What makes this project potentially useful is that it could help flesh out Wikipedia pages by encouraging people to add lists of published works, it could aid bibliographic repositories like my own BioStor by increasing the number of links they get from Wikipedia, and if the Wikipedia page includes external identifiers then it helps us go from strings to things by giving us a way to locate globally unique identifiers for people.

Sunday, August 09, 2015

More Neo4J tests of GBIF taxonomy: Using IPNI to find objective synonyms

Following on from Testing the GBIF taxonomy with the graph database Neo4J I've added a more complex test that relies on linking taxa to names. In this case I've picked some legume genera (Coursetia and Poissonia) where there have been frequent changes of name. By mapping the GBIF taxa to IPNI names (and associated LSIDs) we can build a graph linking taxa to names, and then to objective synonyms (by resolving the IPNI LSIDs and following the links to the basionym), see http://gist.neo4j.org/?4df5af75d42e0f963e5d.

In this example we find species that occur twice in the GBIF taxonomy, which logically should not happen as the names are objective synonyms. We can detect these problems if we have access to nomenclatural data. in this case, because IPNI has tracked the names changes, we can infer that, say, Coursetia heterantha and Poissonia heterantha are synonyms, and hence only one of these should appear in the GBIF classification. This is an example that illustrates the desirability of separating names and taxa, see Modelling taxonomic names in databases.

Possible project: #itaxonomist, combining taxonomic names, DOIs, and ORCID to measure taxonomic impact

E9815d877cd092a19918df74e04f0415Imagine a web site where researchers can go, log in (easily) and get a list of all the species they have described (with pretty pictures and, say, GBIF map), and a list of all DNA sequences/barcodes (if any) that they've published. Imagine that this is displayed in a colourful way (e.g., badges), and the results tweeted with the hastag #itaxonomist.

Imagine that you are not a taxonomist, but if you have worked with one (e.g., published a paper), you can go to the site, log in, and discover that you “know” a taxonomist. Imagine if you are a researcher who has cited taxonomic work, you can log in and discover that your work depends on a taxonomist (think six degrees of Kevin Bacon).

Imagine that this is run as a campaign (hashtag #itaxonomist), with regular announcements leading up to the release date. Imagine if #itaxonomist trends. Imagine the publicity for the work taxonomists do, and the new found ability for them to quantitatively demonstrate this.

How does it work?

#itaxonomist relies on three things:

  1. People having an ORCID
  2. People having publications with DOIs (or otherwise easily identifiable) in their ORCID profile
  3. A map between DOIs (etc.) and the names in the nomenclators (ION, IPNI, Index Fungorum, ZooBank)

Implementation

Under the hood this builds part of the “biodiversity knowledge graph”, and uses ideas I and others have been playing around with (e.g., see David Shorthouse’s neat proof of concept http://collector.shorthouse.net/agent/0000-0002-7260-0350 and my now defunct Mendeley project http://iphylo.blogspot.co.uk/2011/12/these-are-my-species-finding-taxonomic.html).

For a subset of people and names this we could build this very quickly. Some some taxonomists already have ORCIDs , and some nomenclators have limited numbers of DOIs. I am currently building lists of DOIs for primary taxonomic literature, which could be used to seed the database.

The “i am a taxonomist” query is simply a map between ORCID to DOI to name in nomenclator. The “i know a taxonomist” is a map between ORCID and DOI that you share with a taxonomist, but there are no names associated with that DOI (e.g., a paper you have co-authored with a taxonomist that wasn’t on taxonomy, or at least didn’t describe a new species). The “six degrees of taxonomy” relies on the existence of open citation data, which is trickier, but some is available in PubMed Central and/or could be harvested from Pensoft publications.