Thursday, August 18, 2016

GBIF Challenge: €31,000 in prizes for analysing and addressing gaps and biases in primary biodiversity data

Full widthIn a classic paper Boggs (1949) appealed for an “atlas of ignorance”, an honest assessment of what we know we don’t know:

Boggs, S. W.. (1949). An Atlas of Ignorance: A Needed Stimulus to Honest Thinking and Hard Work. Proceedings of the American Philosophical Society, 93(3), 253–258. Retrieved from http://www.jstor.org/stable/3143475

This is the theme of this year's GBIF Challenge: Analysing and addressing gaps and biases in primary biodiversity data. "Gaps" can be gaps in geographic coverage, taxa group, or types of data. GBIF is looking for ways to access the nature of the gaps in the data it is aggregating from its network of contributors.

How to enter

Details on how to enter are on the Challenge website, deadline is September 30th.

Ideas

One approach to gap analysis is to compare what we expect to see with what we actually have. For example, we might take a “well-known” group of organisms and use that to benchmark GBIF’s data coverage. A drawback is that the “well-known” organisms tend to be the usual suspects (birds, mammals, fish, etc.), and there is the issue of whether the chosen group is a useful proxy for other taxa. Another approach is to base the estimate of ignorance on the data itself. For example, OBIS has computed Hurlbert's index of biodiversity for its database, e.g. http://data.unep-wcmc.org/datasets/16 Screenshot 2016 08 18 15 13 59 Can we scale these methods to the 600+ million records in GBIF? There are some clever methods for using resampling methods (such as the bootstrap) on large data sets that might be relevant, see http://www.unofficialgoogledatascience.com/2015/08/an-introduction-to-poisson-bootstrap_26.html.

Another approach might be to compare different datasets for the same taxa, particularly if one data set is not in GBIF. Or perhaps we can compare datasets for the same taxa collected by different methods.

Or we could look at taxonomic gaps. In an earlier post The Zika virus, GBIF, and the missing mosquitoes I noted that GBIF's coverage of vectors of the Zika virus was very poor. How well does GBIF cover vectors and other organisms relevant to human health? Maybe we could generalise this to explore other taxa. It might, for example, be interesting to compare degree of coverage for a species with some measure of the "importance" of that species. Measures of importance could be based on, say, number of hits in Google Scholar for that species, size of Wikipedia page (see Wikipedia mammals and the power law), etc.

Gaps might also be gaps in data completeness, quality, or type.

Summary

This post has barely scratched the surface of what is possible. But I think one important thing to bear in mind is that the best analyses of gaps are those that lead to "actionable insights", in other words, if you are going to enter the challenge (and please do, it's free to enter and there's money to be won), how does you entry help GBIF and the wider biodiversity community decide what to do about gaps?

BioStor updates: nicer map, reference matching service

BioStor now has 150,000 articles. When I wrote a paper describing how BioStor worked it had 26,784 articles, so things have progressed somewhat!

I continue to tweak the interface to BioStor, trying different ways to explore the articles.

Spatial search

I've tweaked spatial search in BioStor. As blogged about previously I replaced the Google Maps interface with Leaflet.js, enabling you to draw a search area on the map and see a set of articles that mention that area. I've changed the base map to the prettier "terrain" map from Stamen, and added back the layer showing all the localities in BioStor. This gives you a much better sense of the geographic coverage in BioStor. This search interface still needs work, but is a fun way to discover content.

Screenshot 2016 08 18 14 04 03

Reference matching

In the "Labs" section of the web site I've added a demonstration of BioStor's reconciliation service. This service is based on the Freebase reconciliation service used by tools such as OpenRefine, see Reconciliation Service API. The goal is to demonstrate a simple way to locate references in BioStor, simply paste references, one per line, click Match and BioStor will attempt to find those references for you.

This service is really intended to be used by tools like OpenRefine, but this web page helps me debug the service.

Suggestions?

BioStor is part labour of love, part albatross around my neck. I'm always open to suggestions for improvements, or for articles to add (but remember that all content must first have been scanned and in the Biodiversity Heritage Library). If you are involved in publishing a journal and are interested in getting it into BHL, please get in touch.

Wednesday, August 17, 2016

Containers, microservices, and data

Docker Some notes on containers, microservices, and data. The idea of packaging software into portable containers and running them either locally or in the cloud is very attractive (see Docker). Some use cases I'm interested in exploring.

Microservices

In Towards a biodiversity knowledge graph (doi:10.3897/rio.2.e8767) I listed a number of services that are essentially self contained, such as name parsers, reconciliation tools, resolvers, etc. Each of these could be packaged up and made into containers.

Databases

We can use containers to package database servers, such as CouchDB, ElasticSearch, and triple stores. Using containers means we don't need to go through the hassle of installing the software locally. Interested in RDF? Spin up a triple store, play with it, then switch it off if you decide it's not for you. If it proves useful, you can move it to the cloud and scale up (e.g., sloppy.io).

Data

A final use case is to put individual datasets in a container. For exmaple, imagine that we have a large Darwin Core Archive. We can distribute this as a simple zip file, but you can't do much with this unless you have code to parse Darwin Core. But imagine we combine that dataset with a simpel visualisation tool, such as VESpeR (see doi:10.1016/j.ecoinf.2014.08.004). Users interested in the data could then play with the data without the overhead of installing specialist software. In a sense, the data becomes an app.

Friday, August 12, 2016

Spatial search in BioStor

I've been experimenting with simple spatial search in BioStor, as shown in the demo below. If you go to the map on BioStor you can use the tools on the left to draw a box or a polygon on the map, and BioStor will search it's database for articles that mention localities that occur in that region. If you click on a marker you can see the title of the article, clicking on that title takes you to the article itself.

This is all rather crude (and a little slow), but it provides another way to dive into the content I've been extracting from the BHL. One thing I've been doing is looking at protected areas (often marked on Open Street Map), drawing a simple polygon around that area, then seeing if BioStor knows anything about that area.

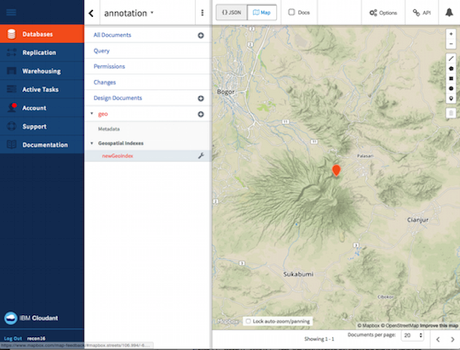
For the technically minded, this tool is an extension of the Searching GBIF by drawing on a map demo, and uses the geospatial indexing offered by Cloudant.

Wednesday, August 10, 2016

On asking for access to data

In between complaining about the lack of open data in biodiversity (especially taxonomy), and scraping data from various web sites to build stuff I'm interested in, I occasionally end up having interesting conversations with the people whose data I've been scraping, cleaning, cross-linking, and otherwise messing with.

Yesterday I had one of those conversations at Kew Gardens. Kew is a large institution that is adjusting to a reduced budget, a changing ditigal landscape, and a rethinking of it's science priorities. Much of Kew's data has not been easily accessible to the outside world, but this is changing. Part of the reason for this is that Defra, which part-funds Kew, is itself opening up (see Ellen Broad's fascinating post Lasers, hedgehogs and the rise of the Age of Yoghurt: reflections on #OpenDefra).

During this conversation I was asked "Why didn't you just ask for the data instead of scraping it? We would most likely have given it to you." My response to this was "well, you might have said no". In my experience saying "no" is easy because it is almost always the less risky approach. And I want a world where we don't have to ask for data, in the same way that we don't ask to get source code for open source software, and we don't ask to download genomic data from GenBank. We just do it and, hopefully, do cool things with it. Just as importantly, if things don't work out and we fail to make cool things, we haven't wasted time negotiating access for something that ultimately didn't work out. The time I lose is simply the time I've spent playing with the data, not any time negotiating access. The more obstacles you put in front of people playing with your data, the fewer innovative uses of that data you're likely to get.

But it was pointed out to me that a consequence of just going ahead and getting the data anyway is that it doesn't necessarily help people within an organisation make the case for being open. The more requests for access to data that are made, the easier it might be to say "people want this data, lets work to make it open". Put another way, by getting the data I want regardless, I sidestep the challenge of convincing people to open up their data. It solves my problem (I want the data now) but doesn't solve it for the wider community (enabling everyone to have access).

I think this is a fair point, but I'm going to try and wiggle away from it. From a purely selfish perspective, my time is limited, there are only so many things I can do, and making the political case for opening up specific data sets is not something I really want to be doing. In a sense, I'm more interested in what happens when the data is open. In other words, let's assume the battle for open has been won, what do we then? So, I'm essentially operating as if the data is already open because I'm betting that it will be at some point in time.

Without wishing to be too self-serving, I think there are ways that treating closed data as effectively open can help make the case that the data should (genuinely) open. For example, one argument for being open is that people will come along and do cool things with the data. In my case, "cool" means cross linking taxonomic names with the primary literature, eventually to original decsriptions and fundamental data about the organisms tagged with the taxonomic names (you may feel that this stretches the definitoon of "cool" somewhat). But adding value to data is hard work, and takes time (in some cases I've invested years in cleaning and linking the data). The benefits from being open may take time, especially if the data is messy, or relatively niche so that few people are prepared to invest the time necessary to do the work.

Some data, such as the examples given in Lasers, hedgehogs and the rise of the Age of Yoghurt: reflections on #OpenDefra will likely be snapped up and give rise to nice visualisations, but a lot of data won't. So, imagine that you're making the case for data to be open, and one of your arguments is "people will do cool things with it", eventually you win that argument, the data is opened up... and nothing happens. Wouldn't it be better if once the data is open, those of us who have been beavering away with "illicit" copies of the data can come out of the woodwork and say "by the way, here are some cool things we've been doing with that data"? OK, this is a fairly self-serving argument, but my point is that while internal arguments about being open are going on I have three choices:

  1. Wait until you open the data (which stops me doing the work I want to do)
  2. Help make the case for being open (which means I engage in politics, an area in which I have zero aptitude)
  3. Assume you will be open eventually, and do the work I want to do so that when you're open I can share that work with you, and everyone else
Call me selfish, but I choose option 3.

Thursday, June 30, 2016

Aggregating annotations on the scientific literature: a followup on the ReCon16 hackday

In the previous post I sketched out a workflow to annotate articles using hypothes.is and aggregate those annotations. I threw this together for the hackday at ReCon 16 in Edinburgh, and the hack day gave me a chance to (a) put together a crude visualisation of the aggregated annotations, and (b) recruit CrossRef's Rachael Lammey (@rachaellammey) into doing some annotations as well so I could test how easy it was to follow my garbled instructions and contribute to the project.

We annotated the paper A new species of shrew (Soricomorpha: Crocidura) from West Java, Indonesia (doi:10.1644/13-MAMM-A-215). If you have the hypothes.is extension installed you will see our annotations on that page, if not, you can see them using the hypothes.is proxy: https://via.hypothes.is/http://dx.doi.org/10.1644/13-MAMM-A-215.

Rachael and I both used the IFTTT tool to send our annotations to a central store. I then created a very crude summary page for those annotations: http://bionames.org/~rpage/recon16-annotation/www/index.html?id=10.1644/13-MAMM-A-215. When this page loads it queries the central store for annotations on the paper with DOI 10.1644/13-MAMM-A-215, then creates some simple summaries.

For example, here is a list of the annotations. The listed is "typed" by tags, that is, you can tell the central store what kind of annotation is being made using the "tag" feature in hypothes.is. On this example, we've picked out taxonomic names, citations, geographical coordinates, specimen codes, grants, etc.

Screenshot 2016 06 30 12 30 53

Given that we have latitude and longitude pairs, we can generate a map: Screenshot 2016 06 30 12 31 15

The names of taxa can be enhanced by adding pictures, so we have a sense of what organisms the paper is about:

Screenshot 2016 06 30 12 31 24

The metadata on the web page for this article is quite rich, and hypothes.is does a nice job of extracting it, so that we have a list of DOIs for many of the articles this paper cites. I've chosen to add annotations for articles that lack DOIs but which may be online elsewhere (e.g., BioStor).

Screenshot 2016 06 30 12 31 34

What's next

This demo shows that it's quite straightforward to annotate an article and pull those annotations together to create a central database that can generate new insights about a paper. For example, we can generate a map even if the original paper doesn't provide one. Conversely, we could use the annotations to link entities such as museum specimens to the literature that discusses those specimens. Given a specimen code in a paper we could look up that code in GBIF (using GBIF's API, or a tool like "Material Examined", see Linking specimen codes to GBIF). Hence we could go from code in paper to GBIF, or potentially from GBIF to the paper that cites the specimen. Having a central annotation store potentially becomes a way to build a knowledge graph linking different entities that we care about.

Of course, a couple of people manually annotating a few papers isn't scalable, but because hypothes.is has an API we can scale this approach (for another experiment see Hypothes.is revisited: annotating articles in BioStor). For example, we have automated tools to locate taxonomic names in text. Imagine that we use those tools to create annotations across the accessible biodiversity literature. We can then aggregate those into a central store and we have an index to the literature based on taxonomic name, but we can also click on any annotation and see that name in context as an annotation on a page. We could manually augment those annotations, if needed, for example by correcting OCR errors.

I think there's scope here for unifying the goals of indexing, annotation, and knowledge graph building with a fairly small set of tools.

Thursday, June 23, 2016

Aggregating annotations on the scientific literature: a hack for ReCon 16

7iUlfzBpI will be at ReCon 16 in Edinburgh (hashtag #ReCon_16), the second ReCon event I've attended (see Thoughts on ReCon 15: DOIs, GitHub, ORCID, altmetric, and transitive credit). For the hack day that follows I've put together some instructions for a way to glue together annotations made by multiple people using hypothes.is. It works by using IFTTT to read a user's annotation stream (i.e., the annotations they've made) and then post those to a CouchDB database hosted by Cloudant.

Why, you might ask? Well, I'm interested in using hypothes.is to make machine-readable annotations on papers. For example, we could select a pair of geographic co-ordinates (latitude and longitude) in a paper, tag it "geo", then have a tool that takes that annotation, converts it to a pair of decimal numbers and renders it on a map.

Screenshot 2016 06 23 15 53 07

Or we could be reading a paper and the literature cited lacks links to the cited literature (i.e., there are no DOIs). We could add those by selecting the reference, pasted in the DOI as the annotation, and tagging it "cites". If we aggregate all those annotations then we could write a query that lists all the DOIs of the cited literature (i.e., it builds a small part of the citation graph).

By aggregating across multiple users we effectively crowd source the annotation problem, but in a way that we can still collect those annotations. For this hack I'm going to automate this collection by enabling each user to create an IFTTT recipe that feeds their annotations into the database (they can switch this feature off at any time by switching off the recipe).

Manual annotation is not scalable, but it does enable us to explore different ways to annotate the literature, and what sort of things people may be interested in. For example, we could flag scientific names, great numbers, localities, specimens, concepts, people, etc. We could explore what degree of post-processing would be needed to make the annotations computable (e.g., converting 8°07′45.73″S, 63°42′09.64″W' into decimal latitude and longitude).

If this project works I hope to learn something about people want to extract from the literature, and to what extent having a database of annotations can provide useful information. This will also help inform my thinking about automated annotation, which I've explored in Hypothes.is revisited: annotating articles in BioStor.

Wednesday, June 22, 2016

What happens when open access wins?

The last few days I've been re-reading articles about Ted Nelson's work (including ill-fated Project Xanadu), reading articles celebrating his work (brought together in the open access book "Intertwingled"), playing with Hypothes.is, and thinking about annotation and linking. One of the things which distinguishes Nelson's view of hypertext from the current web is that for Nelson links are first class citizens, they are persistent, they are bidirectional, and can be links not just documents but between parts of documents. In the web we have links that are unidirectional, when I link to something, the page I link to has no idea that I've made that link. Knowing who links to you turns out to be both hard to work out, and very valuable. In the academic world, links between articles (citations) form the basis of commercial databases such as the Web of Science. And of course, the distribution of links between web pages forms the basis of Google's search engine. Just as attempts to build free and open citation databases have come to nothing, there is no free and open search engine to compete with Google.

The chapters in "Intertwingled" make clear that hypertext had a long and varied history before being subsumed by the web. One project which caught my eye was Microcosm, which lead me to the paper "Dynamic link inclusion in online PDF journals" (doi:10.1007/BFb0053299, there's a free preprint here). This article tackles the problem of adding links to published papers. These links could be to other papers (citations), to data sets, to records in online databases (e.g., DNA sequences), names of organisms, etc. The authors outline four different scenarios for adding these links to an article.

In first scenario the reader obtains a paper from a publisher (either open access from behind a paywall), then using a "linkbase" that they have access too they add link to the paper.

Links1

This is very much what Hypothes.is offers, you use their tools to add annotations to a paper, and those annotations remain under your control.

In the second scenario, the publisher owns the linkbase and provides the reader with an annotated version of the paper.

Links2

This is essentially what tools like ReadCube offer. The two remaining scenarios cover the case where the reader doesn't get the paper from the publisher but instead gets the links. In one of these scenarios (shown below) the reader sends the paper to the publisher and gets the linked paper back in return, in the other (not shown) the reader gets the links but uses their own tools to embed them in the paper.

Links3

If you're still with me at this point you may be wondering how all of this relates to the title of this essay ("What happens when open access wins?"). Well, imagine that academic publishing eventually becomes overwhelmingly open access, so that publishers are making content available for free. Is this a sustainable business model? Might a publisher, seeing the writing on the wall, start to think about what they can charge for, if not articles (I'm deliberately ignoring the "author pays" model of open access as I'm not convinced this has a long term future).

In the diagrams above the "linkbase" is on the publisher's side in two of the three scenarios. If I was a publisher, I'd be looking to assembling proprietary databases and linking tools to create value that I could then charge for. I'm sure this is happening already. I suspect that the growing trend to open access for publications is not going to be enough to keep access to scientific knowledge itself open. In many ways publications themselves aren't terribly useful, it's the knowledge they contain that matters. Extracting, cross linking, and interpreting that knowledge is going to require sophisticated tools. The next challenge is going to be ensuring that the "linkbases" generated by those tools remain free and open, or an "open access" victory may turn out to be hollow.

Thursday, May 26, 2016

Thoughts on Wikipedia, Wikidata, and the Biodiversity Heritage Library

Given that Wikipedia, Wikidata, and the Biodiversity Heritage Library (BHL) all share the goal of making information free, open, and accessible, there seems to be a lot of potential for useful collaboration. Below I sketch out some ideas.

BHL as a source of references for Wikipedia

Wikipedia likes to have sources cited to support claims in its articles. BHL has a lot of articles that could be cited by Wikipedia articles. By adding these links, Wikipedia users get access to further details on the topic of interest. BHL also benefits from greater visibility resulting from visits from Wikipedia readers.

In the short term BHL could search Wikipedia for articles that could benefit from links to BHL (see below). In the long term as more and more BHL articles get DOIs this will become redundant as Wikipedia authors will discover articles via CrossRef.

There are various ways to search Wikipedia to get a sense of what links could be added. For example, you can search the Wikipedia API for pages that link to a particular web domain (see https://www.mediawiki.org/wiki/API:Lists/All#Exturlusage). Here's a search for articles linking to biostor.org https://en.wikipedia.org/w/api.php?action=query&list=exturlusage&euquery=biostor.org&eulimit=20.

A quick inspection suggests that many of these links could be improved (for example, some have outdated links to PDFs and not to the article), so we can locate Wikipedia articles that could be edited. It is likely that Wikipedia articles that have one link to BHL or BioStor may have other citations that could be linked.

Wikipedia as a source of content

One of the big challenges facing BHL is extracting articles from its content. My own BioStor is one approach to tackling this problem. BioStor takes citation details for articles and attempts to locate them in BHL - the limiting factor is access to good-quality citation data. Wikipedia is potentially an untapped source of citation data. Each page that uses the "Cite" template could be mined for citations, which in turn could be used to locate articles. Wikipedia pages using the Cite template can be found via the API, e.g. https://en.wikipedia.org/w/api.php?action=query&list=embeddedin&eititle=Template:Cite&eilimit=20&format=json. Alternatively, we could mine particular types of pages (e.g., those on taxa or taxonomists), or mine Wikispecies (which doesn't use the same citation formatting as Wikipedia).

Wikidata as a data store

If Wikidata aims to be a repository of all structured data relevant to Wikipedia, then this includes bibliographic citations (see WikiCite 2016 ), hence many articles in BHL will end up in Wikidata. This has some interesting implications, because Wikidata can model data with more fidelity than many other sources of bibliographic information. For example, it supports multiple languages as well as multiple representations of the sample language - the journal Acta Herpetologica Sinica https://www.wikidata.org/wiki/Q24159308 in Wikidata has not only the Chinese title (兩棲爬行動物學報) but the pinyin transliteration "Liangqi baxing dongwu yanjiu". Rather than attempt to replicate a community-editable database, Wikidata could be the place to manage article and journal-related metadata.

Disambiguating people

As we move from "strings to things" we need to associate names for things with identifiers for those things. I've touched on this already in Possible project: mapping authors to Wikipedia entries using lists of published works. Ideally each author in BHL would be associated with a globally unique identifier, such as ORCID or ISNI. Contributors to Wikipedia and Wikidata have been collecting these for individuals with Wikipedia articles. If those Wikipedia pages have links to BHL content then we can semi-automate the process of linking people to identifiers.

Caveats

There are a couple of potential "gotchas" concerning Wikipedia and BHL. The licenses used for content are different, BHL is typically CC-BY-NC whereas Wikipedia is CC-BY. The "non commercial" restriction used by BHL is a deal-breaker for sharing content such as page images with Wikicommons.

Wikipedia and Wikidata are communities, and I've often found this makes it challenging to find out how to get things done. Who do you contact to make a decsioon about some new feature you'd like to add? It's not at all obvious (unless you're a part of that community). Existing communities with accepted practices can be resistant to change, or may not be convinced that what you'd like to do is a benefit. For example, I think it would be great to have a Wikipedia page for each journal. Not everyone agrees with this, and one can expend a lot of energy debating the pros and cons. The last time I got seriously engaged with Wikipedia I ended up getting so frustrated I went off in a huff and built my own wiki. This is where a "Wikipedian in residence" might be helpful.

Notes on current and future projects

I'll be taking a break shortly, so I thought I'd try to gather some thoughts on a few projects/ideas that I'm working on. These are essentially extended notes to myself to jog my memory when I return to these topics.

BOLD data into GBIF

Following on from work on getting mosquito data into GBIF I've been looking at DNA barcoding data. BOLD data is mostly absent from GBIF. The publicly available data can be downloaded, and is in a form that could be easily ingested by GBIF. One problem is that the data is incomplete, and sometimes out of date. BOLD's data dumps and BOLD's API use different formats (sigh), and the API returns additional data such as image soft voucher specimens. Most data in the data dumps are not identified to species, so they will have limited utility for most GBIF users.

One approach would be to take the data dumps as the basic data, then use the API to enhance that data, such as adding image links. If the API returns a species-level identification for a barcode then that could be added as an identification using the corresponding Darwin Core extension. In this way we could treat the data as an evolving entity, which it is as our knowledge of it improves. For a related example see Leafcutter bee new to science with specimen data on Canadensys where Canadensys record two different identifications of some bee specimens as research showed that some specimens represented a new species.

This work reflects my concern that GBIF is missing a lot of data outside its normal sources. The mechanism for getting data into GBIF is pretty bureaucratic and could do with reforming (or, at least provision of other ways to add data).

BOLD by itself

I've touched on this before (Notes on next steps for the million DNA barcodes map), I'd really like to do something better with the way we display and interact with DNA barcode data. This will need some thought on calculating and visualising massive phylogenies, and spatial queries that return subtrees. I can't help thinking that there's scope for some very cool things in this area. If nothing else, we can do interesting things without getting involved in some of the pain of taxonomic names.

Big trees

Viewing big trees is still something of an obsession. I still think this hasn't been solved in a way that helps us learn about the tree and the entities in that tree. I currently think that a core problem to solve is how to cluster or "fold" a tree in a sensible way to highlight the major groups. I did something rather crude here, other approaches include "Constructing Overview + Detail Dendrogram-Matrix Views" (doi:10.1109/TVCG.2009.130, PDF here).

Graph databases and the biodiversity knowledge graph

I'm working on a project to build a "biodiversity knowledge graph" (see doi:10.3897/rio.2.e8767). In some ways this is recreating (my entry in Elsevier's Grand Challenge "Knowledge Enhancement in the Life Sciences", see also hdl:10101/npre.2009.3173.1 and doi:10.1016/j.websem.2010.03.004).

Currently I'm playing with Neo4J to build the graph from JSON documents stored in CouchDB. Learning Neo4J is taking a little time, especially as I'm creating nodes and edges on the fly and want to avoid creating more than one node for the same thing. In a world of multiple identifiers this gets tricky, but I think there's a reasonable way to do this (see the graph gist Handling multiple identifiers). Since I'm harvesting data I'm ending up building a web crawler, so I need to think about queues, and ways to ensure that data added at different times gets properly linked.

Wikipedia and wikidata

I occasionally play with Wikipedia and Wikidata, although this is often an exercise in frustration as editing Wikipedia tends to result in edit wars ("we don't do things that way"). Communities tend to be conservative. I'll write up some notes about ways Wikipedia and Wikidata can be useful, especially in the context of the Biodiversity Heritage Library (see also Possible project: mapping authors to Wikipedia entries using lists of published works).

All the names

The database of all taxonomic names remains as elusive as ever -- our field should be deeply embarrassed by this, it's just ridiculous.

My own efforts in this area involve (a) obtaining lists of names, by whatever means available, and (b) augmenting them to include links to the primary literature. I've made some this work publicly accessible (e.g., BioNames). I'd like all name databases to make their data open, but most are resistant to the idea (some aggressively so).

One approach to this is to simply ignore the whimpering and make the data available. Another is to consider recreating the data. We have name finding algorithms, and more of the literature is becoming available, either completely open (e.g., BHL) or accessible to mining (see Content Mine). At some point we will be able to recreate the taxonomic name databases from scratch, making the obstinate data providers not longer relevant.

First descriptions

Names, by themselves, are not terribly useful. But the information that hangs off them is. it occurs to me that projects like BioNames (and other things I've been working on such as IPNI names) aren't directly tackling this. Yes, it's nice to have a bibliographic citation/identifier for the original description of a name (or subsequent name changes), but what we'd really like is to be able to (a) see that description and (b) have it accessible to machines. So one thing I plan to add to BioNames automate going from name to the page with the actual description, and display this information. For many names BioNames knows the page number of the description, and hence it's location within the publication. So we need to simply pull out that page (allowing for edge cases where the mapping between digital and physical pages might not be straight forward) and display it (together with text). If we have XML we can also try and locate the descriptions within the text (for some experiments using XSLT see https://github.com/rdmpage/ipni-names/tree/master/pmc ).There's lots of scope for simple text mining here, such as specimen codes (such as type specimens) and associated taxonomic names (synonyms, ecologically associated organisms, etc.).

Dockerize all the things!

Lots of scope to explore using container to provide services. Docker Hub provides Elastic Search and Neo4J, and Bitnami can run Elastic Search and CouchDB on Google's cloud. Hence we can play with various tools without having to install them. The other side is creating containers to package various tools (Global Names is doing this), or using containers to package up particular datasets and the tools needed to explore them. So much to learn in this area.

Wednesday, May 11, 2016

Scott Federhen

ImagesAwoke this morning to the sad news (via Scott Miller) that Scott Federhen of the NCBI had died. Anyone using the NCBI taxonomy is a beneficiary of Scott's work on bring together taxonomy and genomic data.

Scott contributed both directly and indirectly to this blog. I reported on some of his work linking taxa in NCBI to sequences from type material (NCBI taxonomy database now shows type material), Scott commented on "dark taxa" and DNA barcoding (e.g., Dark taxa even darker: NCBI pulls (some) DNA barcodes from GenBank (updated)), and was an author on a guest post on "Putting GenBank Data on the Map" (in response to http://dx.doi.org/10.1126/science.341.6152.1341-a). He was also very helpful when I wanted to make links between the NCBI taxonomy and Wikipedia in my iPhylo Linkout project (see http://dx.doi.org/10.1371/currents.RRN1228).

I didn't know Scott well, but always enjoyed chatting to him at meetings (most recently the 6th International Barcode of Life Conference at Guelph). He wasn't shy about putting forth his views, or sharing his enthusiasm for ideas. Indeed, last time we met he was handing out paper copies of his preprint "Replication is Recursion; or, Lambda: the Biological Imperative" (available on bioRχiv http://dx.doi.org/10.1101/018804). He then followed up by sending me a t-shirt with the "replication is recursion" logo printed on one side and some penguins on the other (if I remember correctly this was designed by a member of his family). I delight in baffling students by wearing it sometimes when I lecture.

A number of people in the bioinformatics and biodiversity informatics communities are in shock this morning, this is obviously as nothing compared to what his family must be going through.

Tuesday, May 10, 2016

Notes on next steps for the million DNA barcodes map

Some notes to self about future directions for the "million DNA barcodes map" http://iphylo.org/~rpage/bold-map/.

Screenshot 2016 05 10 13 52 09

At the moment we have an interactive map that we can pan and zoom, and click on a marker to get a list of one or more barcodes at the location. We can also filter by major taxonomic group. Here are some ideas on what could be next.

Search

At the moment search is simply browsing the map. It would be handy to be able to enter a taxon or a barcode identifier and go to the corresponding markers on the map.

What is this?

If we have a single DNA barcode I immediately want to know "what is this?" A picture may help, and I may look up the scientific name in BioNames, but perhaps the most obvious thing to do is get a phylogeny for that barcode and similar sequences. These could then be displayed on the map using the technique I described in Visualising Geophylogenies in Web Maps Using GeoJSON (see also http://dx.doi.org/10.1371/currents.tol.8f3c6526c49b136b98ec28e00b570a1e).

So, ideally we would:

  1. Display information about that barcode (e.g., taxonomic identification where known).
  2. Display the local phylogeny of barcodes that contains this barcode.
  3. Display that phylogeny on the map
Hence we need to be able to generate a local phylogeny of barcodes, either on the fly (retrieve similar sequences then build tree) or using a precompute global barcode phylogeny from which we pull out the local subtree.

What is there?

A question that the map doesn't really answer is "what is the diversity of a given area?". Yes there are lots of dots, and you can click on them, but what would be nice is the ability to draw a polygon on the map (like this) and get a summary of the phylogenetic diversity of barcodes within that area.

100144 drummondFor example, imagine drawing a polygon around Little Barrier Island in New Zealand. Can we effectively retrieve the data published by Drummond et al. ( Evaluating a multigene environmental DNA approach for biodiversity assessment DOI:10.1186/s13742-015-0086-1)?.

To support "what is there?" queries we need to be able to:

  1. Draw an arbitrary spatial region region on the map and retrieve a set of sequences found within that region
  2. Retrieve the phylogeny for that set of sequences
Once agin, we either need to be able to build a phylogeny for an arbitrary set of sequences on the fly, or extract a subtree. If the a global tree is available, we could compute the length of the subtree, and also compute a visual layout fairly easily (essentially with time proportional to the number of sequences).

We'd also need to decide on the best way to visualise the phylogeny for the set of sequences. Perhaps something like Krona, or something more traditional.

Screen phymmbl

Summary

There doesn't seme to be any way of getting away from the need for a global phylogeny of COI DNA barcodes if I want to extend the functionality of the map.

State of open knowledge about the World's Plants

A1BHupvRKew has released a new report today, entitled the State of the World's Plants, complete with it's own web site https://stateoftheworldsplants.com. Its aim:

...by bringing the available information together into one document, we hope to raise the profile of plants among the global community and to highlight not only what we do know about threats, status and uses, but also what we don’t. This will help us to decide where more research effort and policy focus is required to preserve and enhance the essential role of plants in underpinning all aspects of human wellbeing.

This is, of course, a laudable goal, and a lot of work has gone into this report, and yet there are some things about the report that I find very frustrating.

  1. PDF but no ePub It's nice to have an interactive web site as well as a glossy PDF, but why restrict yourself to a PDF? Why not an ePub so people can view it and rescale fonts for their device, etc. Why not provide the original text in a form people can translate? The report states that much of the newly discovered plant biodiversity is found in Brazil and China, why not make it easier to support automatic translation into Portuguese and Chinese?
  2. Why no DOI for the report? If this is such an important document, why doesn't it have a DOI so it can be easily cited?
  3. Why no DOIs for cited literature? The report cites 219 references, very few of them are accompanied by a DOI, yet most of the references have them. Why not include the DOI so readers can click on that and go straight to the literature. Surely you want to encourage readers to engage with the subject by reading more? The whole point of having digital documents online is that they can link to other documents.
  4. No open access taxonomy Sadly the examples of exciting new plant species discovered are all in closed access publications, including The Gilbertiodendron species complex (Leguminosae: Caesalpinioideae), Central Africa DOI:10.1007/s12225-015-9579-4 published in Kew's own journal Kew Bulletin. This article costs $39.95 / €34.95 / £29.95 to read. Why do taxonomists continue to publish their research, often about taxa in the developing world, behind paywalls?
  5. Why is the data not open? Much of the section on "Describing the world’s plants" uses data from Kew's database IPNI. This database is not open, so how does the reader verify the numbers in the report? Or, more importantly, how does the reader explore the data further and ask questions not asked in the report?

These may seem like small issues given the subject of the report (the perilous state of much of the planet's biodiversity), but if we are to take seriously the goal of "help[ing] us to decide where more research effort and policy focus is required to preserve and enhance the essential role of plants in underpinning all aspects of human wellbeing" then I suggest that open access to knowledge about plant diversity is a key part of that goal.

Over a decade ago Tom Moritz wrote of the need for a "biodiversity commons": DOI:10.1045/june2002-moritz

Provision of free, universal access to biodiversity information is a practical imperative for the international conservation community — this goal should be accomplished by promotion of the Public Domain and by development of a sustainable Biodiversity Information Commons adapting emergent legal and technical mechanisms to provide a free, secure and persistent environment for access to and use of biodiversity information and data. - "Building the Biodiversity Commons" DOI:10.1045/june2002-moritz

The report itself alludes to the importance of "opening up of global datasets with long-time series (such as maps of forest loss)", and yet botany has been slow to do this for much of its data (see Why are botanists locking away their data in JSTOR Plant Science?). We need data on plant taxonomy, systematics, traits, sequences, and distribution to be open and freely available to all, not closed behind paywalls or limited access APIs. Indeed, Donat Agosti has equated copyright to biopiracy (Biodiversity data are out of local taxonomists' reach DOI:10.1038/439392a.

It would be nice to think that Kew, as well as leading the way in summarising the state of the world's plants, would also be leading the way in making that knowledge about those plants open to all.

Wednesday, April 27, 2016

Possible project: Biodiversity dashboard

Mattern 1 dashboard 1020x703 Despite the well deserved scepticism about dashboards voiced by Shannon Mattern @shannonmattern (see Mission Control: A History of the Urban Dashboard, I discovered this by reading Ignore the Bat Caves and Marketplaces: lets talk about Zoning by Leigh Dodds @ldodds) I'm intrigued by the idea a dashboard for biodiversity. We could have several different kinds of information, displayed in a single place.

Immediate information

There are sites such as Global Forest Watch Fires that track events that affect biodiversity and which are haoppoening right now. Some of this data can be harvested (e.g., from the NASA Fire Information for Resource Management System) to show real-time forest fires. Below is an image for the last 24 hours:

We could also have Twitter feeds of these sorts of events

Historical trends

We could have longer-term trends, such as changes in forest cover, or changes in abundance of species over time.

Trends in information

We could have feeds that show us how our knowledge is changing. For example, we could have a map of data from the newest datasets uploaded to GBIF, the lastest DNA barcodes, etc.

As an example, @wikiredlist tweets overtime an article about a species from the IUCN Red List is edited on the English language Wikipedia.

Imagine several such streams, both as lists and as maps. As another example, a while ago I created a visualisation of new species discoveries:

Summary

I'm aware of the irony of drawing inspiration from a critique of dashboards, but I still think there is value in having an overview of global biodiversity. But we shouldn't loose site of the fact that such views will be biassed and constrained, and in many cases it will be much easy to visualise what is going on (or, at least, what our chosen sources reveal) than to effect change on those trends that we find most alarming.

Thursday, April 21, 2016

Searching GBIF by drawing on a map

One of my frustrations with the GBIF portal is that it is hard to drill down and search in a specific area. You have to zoom in and then click for a list of occurrences in the current bounding box of the map. You can't, for example, draw a polygon such as the boundary of a protected area and search within that area.

As a quick and dirty hack I've thrown together a demo of how it would be possible to search GBIF by drawing the search area on a map. Once a shape is drawn, we call GBIF's API to retrieve the first 300 occurrences from that area. The code is here, and below is a live demo (see also http://bl.ocks.org/rdmpage/43073981694598fecab725a16e890d3b).

This demo uses Leaflet.draw to draw shapes, and Wicket to convert the GeoJSON shape to the WKT format required by GBIF's API. I was inspired by the Leaflet.draw plugin with options set demo by d3noob, and used it as a starting point.

Friday, April 15, 2016

GBIF and impact: CrossRef, FundRef, and Altmetric

Wiki hitFor anyone doing research or involved in scientific infrastructure, demonstrating the "impact" of those activities is becoming increasingly important. This has fostered a growth industry in "alt metrics", tools to track how research gathers attention outside academia (of course, we can argue whether attention is the same as impact).

For an organisation such as GBIF there's a clear need to show that it has impact on the field of biodiversity (and beyond), especially to its funders (which are ultimately national governments). To do this GBIF needs to track how its data is used by the research communities, both to do science and to inform policy. This is hard to do, especially if there's a limited culture of data citation. It occurs to me that another way to tackle this problem is to invert it by looking not at the impact of GBIF, but at GBIF as a source of impact.

For a moment let's replace GBIF with Wikipedia. We can ask "what is the impact of Wikipedia on the research community?" For example, Wikipedia is the 8th largest referrer of DOIs, which means that Wikipedia is a major source traffic to academic publishing sites. All those Wikipedia pages which cite the primary literature are driving traffic to those articles.

Conversely, if we regard Wikipedia as important we can use citations of articles in Wikipedia pages as a measure of a researcher's impact. For example, according to Impact story I am "Wikitastic" as 11 Wikipedia pages cite articles that I am an author of (authorship is discovered by using my ORCID 0000-0002-7101-9767).

Likewise, altmetric tracks citations on Wikipedia, so that a paper like the one below may have minimal social media impact but as the gray donut rings signifying that it's been cited on Wikipedia.

JENKINS, P. D., & ROBINSON, M. F. (2002, June). Another variation on the gymnure theme: description of a new species of Hylomys (Lipotyphla, Erinaceidae, Galericinae). Bulletin of The Natural History Museum. Zoology Series. Cambridge University Press (CUP) doi:10.1017/S0968047002000018

Hence, we can look at Wikipedia in two different ways. The first is to ask "what is the impact of Wikipedia?", the second is to assume that Wikipedia has impact, and then use that as one measure of the impact of researchers (how "Wikitastic" you are).

So, let's go back to GBIF. Imagine we leave aside the question of whether GBIF has impact and imagine that we can use GBIF as a measure of impact ("GBIFtastic", sorry, that was unforgivable).

Example 1: From DOI to FundRef to GBIF

In a previous post I discussed the lack of mosquito data in GBIF and how I plugged this gap by using open data cite by a paper in eLife. This paper has the DOI 10.7554/elife.08347 and if I plug that into CrossRef's search engine I can get back some information on the funders of that paper:

Research funded by Sir Richard Southwood Graduate Scholarship | Rhodes Scholarships | National Institutes of Health (RAPIDD program, R01-AI069341, R01-AI091980, R01-GM08322, N01-A1-25489) | Wellcome Trust (#095066, Vecnet, #099872) | National Aeronautics and Space Administration (#NNX15AF36G) | Biotechnology and Biological Sciences Research Council | Bill and Melinda Gates Foundation (#OPP1053338, #OPP52250) | Studienstiftung des Deutschen Volkes | Directorate-General for Research and Innovation (#21803) | European Centre for Disease Prevention and Control (ECDC/09/018)

Now, this gives me a connection between funding agencies, a paper they funded, and the data in GBIF. For example, the Bill and Melinda Gates Foundation (doi:10.13039/100000865) funded doi:10.7554/elife.08347 which generated data in GBIF doi:10.15468/7apj8n.

I suspect that the Bill and Melinda Gates Foundation don't know that they've funded data gathering that has ended up in GBIF, but I suspect they'd be interested. Especially if that could be quantified (een better if we can demonstrate reuse). The process of linking funders to data can be largely automated, especially as more and more papers are now automatically linked to funder information. The link between publications and data in GBIF can be harder to establish, but at least one publisher (Pensoft) has establish a direct feed from publication to GBIF.

So, what if GBIF could computationally discover the funders of the data it holds, and could then communicate that to the funders. I think there's scope here for funders to take an interest in GBIF and it's role in expanding the reuse (and hence impact) of data that funders have paid for. Demonstrating to governments that national funding agencies are supporting research that generates data that ends up in GBIF may help make the case that GBIF is worth supporting.

Example 2: GBIF as altmetric source

The little altmetric donuts that we see on papers require sources of data, such as Twitter, Wikipedia, blogs, etc. For example, the Plant List dataset I recently put into GBIF has a DOI (doi:10.15468/btkum2)and this has received some attention so it has a altimetric donut (wouldn't it be nice if GBIF showed these on dataset pages?):

What if GBIF itself became a source that altimetric scanned when measuring impact? What if having your papers mentioned in GBIF (for example, as a source of distributional data or a taxonomic name) contributed to the visible impact of that work. Wouldn't that encourage people to mobilise their data? Wouldn't that help people discover the wider conversation about the data and associated publications? Wouldn't that help generate more impact for papers that might otherwise gather less attention?

Summary

I realise that I've somewhat avoided the question of the impact of GBIF itself, which is something that also needs to be tackled (and this is one reason why GBIF assigns DOIs to datasets and downloads to support data citation), but I think that may be only a part of the bigger picture. If we assume GBIF is impactful to start with, then I think we can start to think how GBIF can help persuade researchers and funders that contributing to GBIF is a good thing.

The Zika virus, GBIF, and the missing mosquitoes

One of GBIF's goals is to provide up to date, comprehensive data on the distribution of species. Although GBIF's taxonomy and geographic scope is global, not all species are equal, in the sense that the need for information on some species is potentially much more pressing. An example are mosquitoes of the genus Aedes, such as the species A. aegypti and A. albopictus that spread the Zika virus.

Over the last few days I discovered how poor GBIF's coverage of these two vectors is, and a way to fix that gap quickly. Like many things I work on, I stumbled across the problem by accident. GBIF has released a report on whether GBIF data are fit for modeling species distributions. The publicity material included a psychedelic image showing a map for Aedes aegypti from a recent eLife paper by Kraemer et al. (The global distribution of the arbovirus vectors Aedes aegypti and Ae. albopictus http://doi.org/10.7554/elife.08347 ).

Moritz et al 2015 Global Aedes aegypti distribution detail2

Curious, I read the paper and the phrase "GBIF" occurs only once in the text:

we selected 10,000 occurrence records of Aedes species from the Global Biodiversity Information Facility (http://www.gbif.org), omitting all records of Ae. aegypti and Ae. albopictus. This dataset is intended to reflect biases in mosquito reporting in areas which are suitable for Aedes mosquitoes.

So, GBIF data on these two mosquitoes wasn't used. A quick look at what GBIF had for Aedes albopictus and it's not surprising why GBIF data played such a small role:

1651430

Compare this with the data shown in the Scientific Data paper (http://doi.org/10.1038/sdata.2015.35 on the data that underpins the eLife paper.

Sdata201535 f3

Note the striking lack of any GBIF records from Brazil. Fortunately the data collected by Kraemer et al. are freely available in Dryad http://doi.org/10.5061/dryad.47v3c, so I grabbed the files, fussed about with them a bit (https://github.com/rdmpage/global-distribution-arbovirus-vectors) to get them into the format required by GBIF, and uploaded them. Below is the data for Aedes albopictus in GBIF:

1651430 updated

This is looking more like it! If you are more interested in Aedes aegypti then that data is also available.

Questions

This example raises a number of questions:

  1. How come GBIF had such poor data to start with? If GBIF is going to be relevant to people who need biodiversity data, in some cases urgently, then there's an argument to be made that GBIF should be targeting species such as disease vectors that are likely to be in demand in the future.
  2. Why wasn't the latest data in GBIF? One reason GBIF's data was poor is that the relevant data was widely scattered in the literature (Kraemer et al. list over 1000 papers that they looked at, not including the unpublished sources). This clearly requires a lot of effort to assemble. But once assembled, why wasn't it deposited in GBIF? Is it a case of researchers not thinking this would be a useful thing to do, or not knowing how to do it?
  3. What about all the other data out there? This particular example was prompted by me wondering what is that hideous image on the GBIF post, reading the eLife article, wondering where the data was, and having sufficient access to GBIF to simply upload the data. This is clearly not a scalable approach. How can we improve this process? Can we automate harvesting relevant data from repositories such as Dryad so that this data gets fed into GBIF automatically? Should GBIF become a data repository itself so authors can store their data there? And how do we retrospectively harvest all the rest of the data languishing in the scientific literature?

Side note

One aspect of the Kraemer et al. data I've not focussed on is that it is derived from the literature, most of it unpublished, but some is in the primary literature (the list of papers is missing from the Dryad repository but I obtained a copy from Moritz Kraemer (@MOUGK and it's now on github). This means we can link individual occurrence records back to the evidence for that occurrence (i.e., the paper that made the assertion that this species of mosquito is found at this locality). This means we can (a) provide provenance for the data, and (b) provide credit to the authors of that observation. I hope to explore this topic in a subsequent blog post.

References

Kraemer, M. U. G., Sinka, M. E., Duda, K. A., Mylne, A., Shearer, F. M., Brady, O. J., … Hay, S. I. (2015, July 7). The global compendium of Aedes aegypti and Ae. albopictus occurrence. Scientific Data. Nature Publishing Group. http://doi.org/10.1038/sdata.2015.35

Kraemer, Moritz U. G., Sinka, Marianne E., Duda, Kirsten A., Mylne, Adrian, Shearer, Freya M., Brady, Oliver J., … Hay, Simon I. (2015). Data from: The global compendium of Aedes aegypti and Ae. albopictus occurrence. Dryad Digital Repository. http://doi.org/10.5061/dryad.47v3c

Kraemer, M. U., Sinka, M. E., Duda, K. A., Mylne, A. Q., Shearer, F. M., Barker, C. M., … Hay, S. I. (2015, June 30). The global distribution of the arbovirus vectors Aedes aegypti and Ae. albopictus . eLife. eLife Sciences Organisation, Ltd. http://doi.org/10.7554/elife.08347

The Biodiversity Heritage Library at 10: Let's talk impact interview by @UDCMRK

As part of BHL's "Celebrating 10 years of inspiring discovery through free access to biodiversity knowledge" at the NHM and Kew Gardens in London, I was interviewed by Martin Kalfatovic (@UDCMRK). We chatted about BHL, the work I've been doing on BioStor, and the future of BHL. I haven't had the courage to watch it myself, but if you want to watch an academic giving Roger Hyam a run for his money in the "flappy hands" stakes, and not knowing whether to look at the camera, Martin, or towards the distant horizon, then here is the video.

Friday, April 08, 2016

Guest post: 10 explanations for messy data, by Bob Mesibov

The follow is a guest post by Bob Mesibov, who has contributed to iPhylo before. Bob

Like many iPhylo readers, I deal with large, pre-existing compilations of biodiversity data. The compilations come from museums, herbaria, aggregation projects and government agencies. For simplicity in what follows and to avoid naming names, I'll lump all these sources into a single fictional entity, the PAI (for Projects, Agencies and Institutions).

The datasets I get from the PAI typically contain duplicate records, inconsistencies in content and format, unexplained data gaps, data in wrong fields, fields improperly used, no flagging of doubtful data, etc. Data cleaning consumes most of the time I spend on a data project. Cleaning can take weeks, analysing the cleaned data takes minutes, reporting the results of the analysis takes hours or days. (Example: doi:10.3897/BDJ.2.e1160)

I can understand how datasets get messy. Data entry errors account for a lot of the problems I see, and I make data entry errors myself. But the causes of messiness are one thing and its cure is another. The custodians of those data compilations don't seem to have done much (or any) data checking. Why not?

When I'm brave enough to ask that question, I usually get a polite response from the PAI. Here are 10 explanations I've heard for inadequate data checking and cleaning:

(1) The data are fit for use, as-is. No cleaning is needed, because the data are fit for some use, and the PAI is satisfied with that. One data manager wrote to me in an email: '...even records with lower certainty, in this case an uncertain identification, can be useful at a coarser resolution. Although we have no idea as to the reliability of the identification to the species or even genus they are likely correctly identify[ing] something as at least an animal, arthropod and possibly to class so the record is suitable for analysis at that level.'

(2) The PAI is exposing its data online. The crowd will spot any problems and tell the PAI about them.

I've previously pointed out (doiL10.3897/zookeys.293.5111) how lame this explanation is. As a strategy for data cleaning it's slow, piecemeal and wildly optimistic. At best, it accumulates data-cleaning 'tickets' with no guarantee that any will ever be closed. What I hear from the PAI is 'We're aware of problems of that kind and are hoping to find a general solution, rather than deal with a multitude of individual cases'. Years pass and the individual cases don't get fixed, so interested members of the crowd lose faith in the process and stop reporting problems.

(3) No one outside the PAI is allowed to look at the whole dataset, and no one inside the PAI has the time (or skills) to do data checking and cleaning.

This is a particularly nice Catch-22. I once offered to check a portion of the PAI's data holdings for free, and was told that PAI policy was that the dataset was not to be shared with anyone outside the PAI. The same data were freely available on the PAI's website in bits and pieces through a database search page.

(4) The PAI is migrating to new database software next year. Data cleaning will be part of the migration.

No, it won't. Note that this response isn't always simple procrastination, because it's sometimes the case that the PAI's database has only limited capabilities for data checking and editing. PAI staff are hopeful that checking and editing will be easier with the new software. They'll be disappointed.

(5) The person who manages data is on leave / was seconded to another project / resigned and hasn't been replaced yet / etc.

This is another way of saying that no one inside the PAI has the time to do data checking and cleaning. When the data manager returns to work or gets replaced, data checking and cleaning will have the same low priority it had before. That's why it didn't get done.

(6) Top management says any data cleaning would have to be done by outside specialists, but there's not enough money in the current budget to hire such people.

Not only a Catch-22, but a solid, long-term excuse, applicable in any financial year. It would cost less to train PAI staff to do the job in-house.

(7) The PAI would prefer to use a specialist data tool to clean data, like OpenRefine, but hasn't yet got up to speed on its use.

The PAI believes in magic. OpenRefine will magically clean the data without any thought required on the part of PAI staff. The magic will have to be applied repeatedly, because the sources of the duplications, gaps and errors haven't been found and squashed.

(8) The PAI staff best qualified to check and clean the data aren't allowed to do so.

IT policy strictly forbids anyone but IT staff from tinkering with the PAI database, whose integrity is sacrosanct. A very specific request from biodiversity staff may be ticketed by IT staff for action, but global checking and editing is out of the question. IT staff are not expected to understand biodiversity studies, and biodiversity staff are not expected to understand databases.

This explanation is interesting because it implies a workaround. If a biodiversity staffer can get a dump from the database as a simple text file, she can do global checking and editing of the data using the command line or a spreadsheet. The cleaned data can then be passed to IT staff for incorporation into the database as replacement data items. The day that happens, pigs will be seen flying outside the PAI windows.

(9) The PAI datasets have grown so big that global data checking and editing is no longer possible.

Harder, yes; impossible, no. And the datasets didn't suddenly appear, they grew by accretion. Why wasn't data checking and editing done as data was added?

(10) All datasets are messy and data users should do their own data cleaning.

The PAI shrugs its shoulders and says 'That's just the way it is, live with it. Our data are no messier than anyone else's'.

I've left this explanation for last because it begs the question. Yes, users can do their own data cleaning — because it's not that hard and there are many ways to do it. So why isn't it done by highly qualified, well-paid PAI data managers?

Towards a biodiversity knowledge graph now in RIO

E2asamswAfter experimenting with a dynamic, online version of my notes "Towards a biodiversity knowledge graph" I've published a static version in RIO: doi:10.3897/rio.2.e8767.

Friday, March 18, 2016

The Plant List, GBIF, and the primary literature

TL;DR; The Plant List is now in GBIF http://doi.org/10.15468/btkum2.

Readers of this blog may recall that I've had a somewhat jaundiced view of The Plant List. The first version was release with a Creative Commons Attribution-NonCommercial-NoDerivs (CC BY-NC-ND) license which allowed copying so long as didn't create a derived work (The Plant List: nice data, shame it's not open). This is frankly about the silliest possible license for a data set as, from my perspective, the whole reason for releasing data is so that it can be combined and enhanced with other data.

The second release (version 1.1) dropped an explicit CC license in favour of almost the reverse position (!). You can't copy the list "as is" without permission, but you can make derivative works "without prior written permission from us" (see Terms of Use for The Plant List). Progress, of a sort.

So, for the last week I've been working on getting a version of The Plant List into GBIF, and I've finally managed to achieve this. There's isn't a single place you can grab the whole plant list, so you have to scrape the web site for CSV files, then glue them together. I would could argue that converting the data into the Darwin Core Archive is a derived work, but in case this seems not derivative enough (of course, nobody seems ready to define just what "derived" actually means) I started to augment the list of names by adding bibliographic identifiers. I've long argued (see e.g. Surfacing the deep data of taxonomy) that a fundamental limitation of existing taxonomic database is that they don't explicitly link to the primary literature. This is why I built BioNames, and why I've been working to link the "micro citations" in IPNI to identifiers such as DOIs, JSTOR likes, BioStor URLs and BHL page links (see project on github). So, I've added about 120,000 DOIs and JSTOR links to names in the plant list. This is a subset of the links I've found for IPNI, but for this first release I've tried to keep things simple. I've also made the link between Plant List name and DOI/JSTOR via the IPNI identifier for a name, and the Plant List has ommitted quite a few IPNI ids for reasons which aren't clear.

The Plant List version I've created is available in GBIF (http://doi.org/10.15468/btkum2 and http://www.gbif.org/dataset/d9a4eedb-e985-4456-ad46-3df8472e00e8). Having another list of plant names will be a useful addition to the checklists that GBIF already has, even if the Plant List is already somewhat out of date.

DOIs

One feature of enhanced Plant List in GBIF is that for a subset of names (currently about 10%) there are direct links to the original publication of that name. For example, the record for Haniffia albiflora in the Plant List has a fairly cryptic bibliographic citation Nordic J. Bot. 20: 287 2000 and no link to that publication. In the version I've uploaded to GBIF the name Haniffia albiflora looks like this: Haniffia Note the full citation. But more importantly, the Publisher record link is the DOI http://doi.org/10.1111/j.1756-1051.2000.tb00745.x so clicking on it takes you to the original description of this species: Doi4 There is a lot of plant taxonomic literature available in JSTOR, sadly most of it (along with specimen images) behind a paywall (see Why are botanists locking away their data in JSTOR Plant Science?). Some of the links from GBIF take you to JSTOR: Doi3 The DOI landscape is evolving, and there are now multiple DOI registration agencies minting DOIs for scientific papers. CrossRef provides easily the best services for discovery and metadata harvesting, other agencies often have no equivalent, which makes it hard to discover DOIs for those papers hard. I've spent some time getting this information for Chinese and Taiwanese articles, e.g. http://dx.doi.org/10.6165/tai.1985.30.5: Doi1 and http://dx.doi.org/10.3969/j.issn.2095-0845.2005.04.002: Doi2 to give two example of articles that are now linked to from the corresponding species page in GBIF.
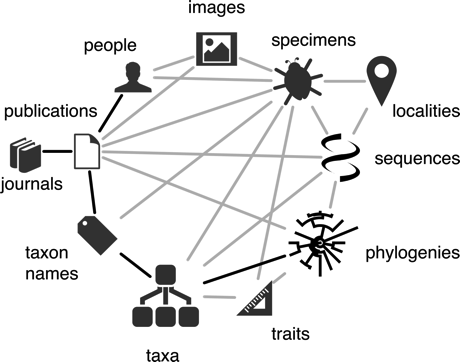
It's all about the links To reiterate, I believe that one of the key challenges facing biodiversity informatics is cross linking between disparate types of data and source of information. At the moment most of our data resides in disconnected silos. The links I'm adding to plant names are a small step, but they can lead to all sorts of possibilities. For example, users of GBIF can click on a link and see the original paper. If, for example, GBIF doesn't have a map for the species discussed in that paper, it's likely that the paper may have some information (e.g., the type locality). If users click on the links, then that is going to drive more traffic to the original literature, thus increasing its visibility. Furthermore, now that we have a taxon identifier (from GBIF) linked to a bibliographic identifier, we can go in the opposite direction. Earlier I proposed a Javascript bookmarklet as a way to augment the information on a web page (see Rethinking annotating biodiversity data). We could have a popup on a article web page that can tell the user about the taxa mentioned in that paper. If GBIF has a ma for those taxa, we can immediately place that paper in a geospatial context (e.g., Africa). This is barely scratching the surface of what is possible once we start breaking out of silos and share deeply linked data.

Monday, March 14, 2016

Towards a biodiversity knowledge graph

TL;DR; In order to build a usable biodiversity knowledge graph we should adopt JSON-LD for biodiversity data, develop reconciliation services to match entities to identifiers, and a use a mixture of document and graph databases to store and query the data. To bootstrap this project we can create wrappers around each biodiversity data provider, and a central cache that is both a document store and a simple graph database. This power of this approach should be showcased by applications that use the central cache to tackle specific problems, such as augmenting existing data.
Fig 1 full

I’ve thrown together some notes on building a biodiversity knowledge graph, and in the interests of making it interactive it's in the form of a web page: http://bionames.org/~rpage/towards-knowledge-graph/. There are buttons to click that display live data, and I hope to dd more examples as I flesh out the ideas. I'm hoping to have a fully-functioning live demo that can be used to explore the notion of a knowledge graph and demonstrate what we can do with it. It will be pretty obvious that this is all a bit crude, but my goal is to try and sketch out a fully-functioning system that can create and query the graph, and support interesting applications.

Thursday, March 03, 2016

Cisco Pit Stop: Digitising the Natural History Museum’s collections

Last week (25-26 February) I was in London for CISCO Pit Stop event. Thursday evening was at the Natural History Museum where I gave a talk extolling the virtues of linking stuff together:

My slides are here:

Friday we assembled at the Digital Catapult Centre, which as Sandy Knapp notes, has some amazing views from it's 9th floor.

A group of experts (loosely defined, at least, if they include me in that category) and small businesses (with backgrounds in digitisation, text-mining, publishing, etc.) got together to try and come up with workable ideas where we could marry issues in digitisation and subsequent use of that data with tools and markets. A fascinating experience, although I'm not yet sure what the outcome will be. But it's always useful talking (and listening) to people with very different backgrounds and notions of what matters (and what is possible).

iSpecies meets TreeBASE

I'm continuing to play with the new version of iSpecies, seeing just how far one can get by simply grabbing JSON from various sources and mashing them up. Since the Open Tree of Life is pretty unresolved ("OMG it's full of stars") I've started to grab trees from TreeBASE and add those. Sadly TreeBASE is showing it's age and doesn't have a JSON API, so I had to break my rule of only using HTML and Javascript in iSpecies and I had to write some PHP wrappers to talk to TreeBASE. Now, when you search for a genus or species you may see a list of studies from TreeBASE, and a popup menu where you can select a tree to view.

Below is a example (searching for the plant genus Fitzalania). Ispecies treebase

This example shows one reason phylogenies are useful. Although GBIF (which supplies the data for the map) recognises Fitzalania, a recent study in TreeBASE shows that this renders Meiogyne paraphyletic, and so moves the Fitzalania to Meiogyne. Hence GBIF's taxonomy is somewhat behind the current state of knowledge about these plants.

The paper merging these two genra (doi:10.1600/036364414x680825) also shows up in the CrossRef results. Unfortunately TreeBASE doesn't have the DOI for the paper, so linking these two results (the TreeBASE study and the corresponding paper) will require some work. This is another reason why I'm playing with iSpecies: I want to see how many identifiers we can uncover to connect results from different sources, and how many cross links we need to add before it all comes together in a nice linked graph of data.