Thursday, June 25, 2015

Biodiversity Data Journal data lost on the way to GBIF and EOL

Two ongoing challenges in biodiversity informatics are getting data into a form that is usable, and linking that data across different projects platforms. A recent and interesting approach to this problem are "data journals" as exemplified by the Biodiversity Data Journal. I've been exploring some data from this journal that has been aggregated by GBIf and EOL, and have come across a few issues. In this post I'll firstly outline the standard format for moving data between biodiversity projects, the Darwin Core Archive, then illustrate some of the pitfalls.

Darwin Core Archive

Firstly a quick digression on the Darwin Core Archive format, which has a few gotchas for newcomers to the format (such as myself). The Darwin Core Archive supports a "star schema" like this.

Dwca

At the centre of the star is a table containing data either about taxa or occurrences. We can have additional tables with other sorts of data, and we also have a meta.xml file which tells us what all the data columns are and how the different tables are related to the core table.

For example, if we have taxa as our core, then we can have a table like this were each taxon has a unique taxon_id:

taxon_idtaxon stuff
1stuff
2stuff
3stuff

Now, imagine that we have a reference for each of these taxa (say it's the paper that originally described these species). Then we could add a unique identifier for that reference reference_id to the taxon table:

taxon_idreference_idtaxon stuff
1astuff
2astuff
3astuff

Now, if we were building a relational database we could have a separate table for the references, and link the two table using the reference_id as a primary key for the references and as a foreign key in the taxon table, like this:

reference_idreference stuff
areference

This means that we need only have the reference stored once, which means there's no redundancy. If we need to update the reference data, we only need to do it once.

However, this is not how Darwin Core Archive works. Because it's a star schema, we need to have a references table like this:

reference_idtaxon_idreference stuff
a1reference
a2reference
a3reference

Note that we have added the taxon_id to link the reference to each taxon, and that the same reference occurs three times (once for each taxon it refers to), hence we have redundancy. Note also that if we don't include the taxon_id key then there's no way for a Darwin Core Archive reader to link the reference to the corresponding taxa (we'll come back to this below).

I've said that the reference are in their own table. In fact, we can have everything in one big table, and use the meta.xml table to tell a Darwin Core Archive reader to process that same table but extract different data each time (the Mammal Species of the World checklist http://doi.org/10.15468/csfquc is an example of this). Hence, we could extract taxon_id and taxon stuff for the taxa, then reference_id, reference stuff for the references.

taxon_idreference_idtaxon stuffreference stuff
1astuffreference
2astuffreference
3astuffreference

The other thing to remember is that the meta.xml file is responsible for describing the data. It does this in two ways (1) it defines the type of data a given table contains (e.g., taxa, occurrence, image, etc.), and (2) it defines what each column in the data represents, using a controlled vocabulary.

The type of data each table contains is defined by a URI, and the list of these "registered extensions" is available from GBIF. The two "core" extensions are for taxa and occurrences, the two things GBIF primarily deals with, while the other extensions enable richer data to be added. Of course, a Darwin Core Archive consumer that doesn't understand these extensions can simply ignore them. Rather unfortunately, some extensions, such as the EOL media and references extensions overlap with the GBIF multimedia and references extensions. Hence, if you have, say images or bibliographic data, you have two extensions to choose from. If you choose EOL's then EOL will import your data, but GBIF won't. Furthermore, the extensions vary in richness. If you have bibliographic data then GBIF's vocabulary for references looks sparse and lacking many of the fields one might expect, whereas EOL's is quite rich.

Problems with Biodiversity Data Journal and GBIF

With that background, let's take a look at what happens to Biodiversity Data Journal (BDJ) data once it enters GBIF. For example, the species Eupolybothrus cavernicolus, described using "transcriptomic, DNA barcoding and micro-CT imaging data" (http://dx.doi.org/10.3897/BDJ.1.e1013). Data from this paper is in GBIF as both an occurrence dataset (http://doi.org/10.15468/zpz4ls) and checklist dataset (http://doi.org/10.15468/rpavbl).

Images

The checklist dataset includes both media and references. The images don't appear in GBIF, but are visible in EOL (e.g., http://eol.org/data_objects/26558840 shown below:

36163 orig Because the type for the media is set to a type (http://eol.org/schema/media/Document) that only EOL recognises, GBIF doesn't harvest the images, and hence misses out on all this extra multimedia goodness.

References

The references in the BDJ dataset don't appear in either GBIF or EOL (see http://eol.org/pages/38177334/literature). Presumably they don't appear in GBIF because BDJ uses EOL's extension, but why don't they appear in EOL? Looking at the raw data, the references.csv file in the Darwin Core lacks the coreid field needed to link the references to the corresponding taxon (the fiels is defined in the meta.xml file, but there is no corresponding column in the references.csv file. Looking at other BDJ Darwin Core Archives this seems to be a common problem.

Map

Strangely the BDJ paper shows a map with a point locality, but the same data in GBIF does not (see http://doi.org/10.15468/zpz4ls). Mapbdj

A look at the occurrences.csv shows that the file has verbatim latitude and longitude but not decimal versions of the coordinates, which is what GBIF uses to locate records on the map. So the BDJ data set isn't contributing any geographical data. Clearly a lot of BDJ data is georeferenced (see map), but not this example.

Taxa

The centipede Eupolybothrus cavernicolus is not in GBIF's backbone classification. This is a common issue, especially with newly described taxa. GBIF does not have access to recent nomenclatural data, and so even though the BDJ data comes with a ZooBank LSID urn:lsid:zoobank.org:act:6F9A6F3C-687A-436A-9497-70596584678C for the name Eupolybothrus cavernicolus, GBIF itself doesn't know about and so if you do a default search on the name Eupolybothrus cavernicolus you get only the genus.

Summary

Here are the issues I uncovered after a little bit of messing about:

  1. BDJ Darwin Core Archives don't support extensions recognised by GBIF.
  2. BDJ references lack the coreid for the taxa/occurrences and hence are not ingested by Darwin Core readers.
  3. BDJ does not seem to parse and interpret verbatim coordinates when generating Darwin Core Archives.
  4. GBIF doesn't support the extensions output by BDJ.
  5. GBIF's references extension is woefully inadequate for handling bibliographic metadata.
  6. GBIF's list of taxonomic names is woefully out of date.

What both puzzles and frustrates me is that a much trumpeted collaboration between these projects has significant problems which seem to have gone undetected. It seems as if it is enough to have a pipeline between a data journal and a project, without actually testing whether that pipeline loses or misrepresents the data. In some cases, very little of the data in a BDJ archive actually makes it into GBIF, which is wasteful and rather defeats the point of having a data journal to database pipeline in the first place.

Wednesday, June 24, 2015

Thoughts on ReCon 15: DOIs, GitHub, ORCID, altmetric, and transitive credit

Man03gTw 400x400I spent last Friday and Saturday at (Research in the 21st Century: Data, Analytics and Impact, hashtag #ReCon_15) in Edinburgh. Friday 19th was conference day, followed by a hackday at CodeBase. There's a Storify archive of the tweets so you can get a sense of the meeting.

Sitting in the audience a few things struck me.

  1. No identifier wars, DOIs have won and are everywhere.
  2. GitHub is influencing the way we do science, but we've much still to learn.
  3. ORCIDs are gaining traction.
  4. Nobody really understands "impact".

GitHub

GitHub is becoming more and more important, not only as a repository of scientific code and data, but as a useful model of sorts of things we need to be doing. Arron Smith gave a fascinating talk on GitHub. Apart from the obvious things such as version control, Arfon discussed the tools and mindset of open source programmers, and who that could be applied to scientific data. For example, software on GitHub is often automatically tested for bugs (and GitHub displays a badge saying whether things are OK). Imagine doing this for a data set, having it automatically checked for errors and/or internal consistency. Reproducibility is a big topic in science, but open source software has to be reproducible by default in the sense that it has to be able to be downloaded and compiled on a user's computer. This is just a couple of the things Arfon covered, see his slides for more.

Transitive Credit

One idea which particularly struck me was that of "transitive credit":

Katz, D. S. (2014, February 10). Transitive Credit as a Means to Address Social and Technological Concerns Stemming from Citation and Attribution of Digital Products. JORS. Ubiquity Press, Ltd. http://doi.org/10.5334/jors.be

From the above paper:

The idea of transitive credit is as follows: The credit map for product A, which is used by product B, feeds into the credit map for product B. For example, product A is a software package equally written by two authors and its credit map is that 50 percent of the credit for this should go the lead developer, 20 percent to the second developer, and 10 percent to the third developer. In addition, 5 percent should go to each of the four libraries that are needed to run the code. When this product is created and registered, this credit map is registered along with it. Product B is a paper that obtains new science results, and it depended on Product A. The person who registers the publication also registers its credit map, in this case 75 percent to her/himself, and 25 percent to the software code previous mentioned. Credit is now transitive, in that the lead software developer of the code can be given credit for 12.5 percent of the paper. If another paper is later written that extends the product B paper and gives 10% credit to that paper, the lead software package developer will also have 1.25% credit for the new paper.
The idea of being able to track credit across derived products is interesting, and is especially relevant to projects such as GBIF, where users can download large datasets that are themselves aggregations of data from numerous different providers (making it was to calculate the relative contributions of each provider). If we then track citations of that data (and citations of those citations) we could give data providers a better estimate of the actual impact of their data.

Impact

Euan Adie of altimetric talked about "impact", and remarked on an example of a paper being cited in a policy document and this being picked up by altimetric and seen by the authors of the paper, who had no idea that their work had influenced a policy document. This raises some intriguing possibilities, related to the idea of "transitive credit" above.

In building BioNames I've added the ability to show altimetric "donuts" and I'm struck by examples like this one (see also reference in BioNames):

JENKINS, P. D., & ROBINSON, M. F. (2002, June). Another variation on the gymnure theme: description of a new species of Hylomys (Lipotyphla, Erinaceidae, Galericinae). Bulletin of The Natural History Museum. Zoology Series. Cambridge University Press (CUP) doi:10.1017/S0968047002000018

This paper has no recent "buzz" (e.g., Twitter, Facebook, Mendeley) but is cited on three Wikipedia pages. So, this paper has impact, albeit in social media. Many papers like this will slip below the social media radar but will be used by various databases and may contribute to subsequent work. Perhaps we could expand alt metrics sources of information to include some of those databases. For example, if a paper has been aggregated/cited by a major databases (such as GBIF) then it would be nice to see that on the altimetric donut. For authors this gives them another example of the impact of their work, but for the databases it's also an opportunity to increase engagement (if people have relevant work that doesn't appear in the donut they can take steps to have that work included in the aggregation). Obviously there are issues about what databases to count as providing signal for alt metrics, but there's scope here to broaden and quantify our notion of impact.

Hackday

The ReCon hackney was an pretty informal event held at CodeBase just down from Edinburgh Castle, and apparently the largest start-up incubator in the European tech scene. It was a pretty amazing place, and a great venue for a hackney. I spent the day looking at the ORCID API and seeing if I could create some mashups with Journal Map and my own BioNames. One goal was to see if we could generate a map of researcher's study sites starting with their ORCID, using ORCID's API to retrieve a list of their publications, then talking to the Journal Map API to get point localities for those papers. The code worked, but the results were a little disappointing because Jim Caryl and I were focussing on University of Glasgow researchers, and they had few papesri n Journal Map. The code, such as it is, is in GitHub.

My original idea was to focus on BioNames, and see how many authors of taxonomic papers had ORCIDs. Initial experiments seemed promising (see GitHub for code and data). Time was limited, so I got as far has building lists of DOIs from BioNames and discovering the associated ORCIDs. The next steps would be (a) providing ORCID login to BioNames, and using ORCID to help cluster author name strings in BioNames. Still much to do.

I've not been to many hackdays/hackathons, but I find them much more rewarding than simply sitting in a lecture theatre and listening to people talk. Combining both types of meeting is great, and I look forward to similar event sin the future.

Visualising Geophylogenies in Web Maps Using GeoJSON

Fig3 GoogleMaps CC BY no logo 300x205I've published a short note on my work on geophylogenies and GeoJSON in PLoS Currents Tree of Life:

Page R. Visualising Geophylogenies in Web Maps Using GeoJSON. PLOS Currents Tree of Life. 2015 Jun 23 . Edition 1. doi:10.1371/currents.tol.8f3c6526c49b136b98ec28e00b570a1e.
At the time of writing the DOI hasn't registered, so the direct link is here. There is a GitHub repository for the manuscript and code.

I chose PLoS Currents Tree of Life because it is (supposedly) quick and cheap. Unfortunately a perfect storm of delays in reviewing together with licensing issues resulted in the paper taking nearly three months to appear. The licensing issues were a headache. PLoS uses the Creative Commons CC-BY license for all its content. Unfortunately, the original submission included maps from Google Maps and Open Street Map (OSM), to show that the GeoJSON produced by my tool could work with either. Google Maps tile imagery is not freely available, so I had to replace that in order for PLoS to be able to publish my figures. At first I used simply replaced the tiles Google Maps displays with ones from OSM, but those tiles are CC-BY-SA, which is incompatible with PLoS's use of CC-BY. Argh! I got stroppy about this on Twitter:

Eventually I discovered maps from CartoDB that have CC-BY licenses, and so could be used in the PLoS Currents article. After replacing Google's and OSM tiles with these maps (and trimming off the "Google" logo) the figures were acceptable to PLoS. Increasingly I think Creative Commons has resulted in a mess of mutually incompatible licenses that make mashing up things hard. The idea was great ("skip the intermediaries" by declaring that your content can be used), but the outcome is messy and frustrating.

But, enough grumbling. The article is out, the code is in GitHib. Now to think about how to use it.

Tuesday, May 19, 2015

Text mining for museum specimen identifiers

Class EMuMedia phpThis post is a response to Ross Mounce's post Text mining for museum specimen identifiers. As Ross notes in that post, mining literature for specimen codes is something I've been interested in for a while (search for specimen codes on iPhylo), and @Aime Rankin (formerly an undergraduate student at Glasgow) did some work on this as well. It's great to see progress in this area.

Here are some thoughts on Ross's post (I'm posting here rather than as a comment on Ross's blog because this is going to be long).

What questions to ask?

Obviously there's a lot of scope for metrics, such as numbers of citations for individual specimens, and league tables for collections (see GBIF specimens in BioStor: who are the top ten museums with citable specimens?). As Ross notes, there's also scope for updating out of date museum metadata with information from the literature (e.g., Linking data from the NHM portal with content in BHL), but even more interesting is the potential to cross-link databases in a way that permits novel queries. For example, if we have a paper on a disease that includes data we can link to a georeferenced specimen, then we can enable spatial queries for diseases (e.g., BHL and GBIF as biomedical databases).

Materials for mining

From my perspective the obvious corpus to mine is the Biodiversity Heritage Library (BHL). Ross repeats the erroneous view that BHL is just "legacy" literature. Apart from the obvious point that everything not published right not is, by definition, legacy, BHL has a lot of modern content (including papers published in the last couple of years).

Furthermore, there are journals that cite Natural History Museum specimens, including "in house" journals (e.g., Bulletin of the British Museum (Natural History) Zoology and Bulletin of the Natural History Museum. Zoology series), as well as the Bulletin of the British Ornithologists' Club which has published lots of new bird names for which the type specimen is often in the NHM.

I guess one issue is accessibility. Ross notes that:

The PMC OA subset is fantastic & really facilitates this kind of research – I wish ALL of the biodiversity literature was aggregated like (some) of the open access biomedical literature is. You can literally just download a million papers, click, and go do your research. It facilitates rigorous research by allowing full machine access to full texts.
So, how we can make BHL content as accessible? For each article I've extracted from BHL and stored in BioStor you can get full text by simply appending ".text" to the BioStor URL, but this isn't quite the same as grabbing a big dump of text.

The other source of mining is GenBank, which has a lot of sequences that have NHM vouchers, but also a weird and wonderful array of ways of recording those specimens. This is one reason I'm building "Material examined", to cope with these codes. For example sequence KF281084 has voucher "TRING 1877111743" which more traditionally would be written as "BMNH 1877.11.17.43", which is "NHMUK 1877.11.17.43" in the NHM database. This is just one example of the horrors of matching specimen codes (for more see the code for Material examined).

One reason GenBank is useful is that the sequences are often linked to the literature, which means you get to make the link between specimen and literature without actually needing to mine the text itself (handy if access is problematic).

Bonus question: How should I publish this annotation data?

But if I wanted to publish something a little better & a little more formal, what kind of RDF vocabulary can I use to describe “occurs in” or “is mentioned in”. What would be the most useful format to publish this data in so that it can be re-used and extended to become part of the biodiversity knowledge graph and have lasting value?
Personally I'd avoid RDF because that way lies madness (or at least endless detours haggling about ontologies).

But making the output useful is an important question. Despite the fact that it is a bit clunky, I suspect Darwin Core Archives are the way to go. The core data is a CSV table, so it's easy to generate, and also easy to use. Lets say you analysed a particular corpus (e.g., PLoS ONE), you could then output the data in Darwin Core (making sure both specimen and publication had stable identifiers), then package it up and upload to Zenodo or Figshare and get a DOI. For bonus points, it would be great to see this data on GBIF, but this would require (a) mapping NHM specimen codes to GBIF ids (the NHM has this), and (b) GBIF being able to recognise that the data you're adding is not new specimens but rather annotations of existing specimens.

Things to think about

Here are a couple of additional things to think about.

Specimen finding as a service

In the same way that we have taxonomic name-finding services, it would be great if we had a specimen code-finding service. I have code that I use in BioStor, but it would be great to have something that is robust, stable, and generalisable across multiple specimen codes. My tool Material examined focusses on parsing a single string rather than parsing a block of text, but adding that functionality is an obvious thing to do.

Markup as output

One concern I have with work that involves mining text is that we hardly ever store the intermediate step of text + located elements. Instead we get to see sumamry output (e.g., this page has these three scientific names, and these 10 specimen codes). As Terry Catapano (@catapanoth) once wisely pointed out "indexing is markup", in that if you find a substring in some text, you have in effect marked up the text. Can we preserved the marked up text so that we go back and look at it and improve our text mining methods, or make that markup available to others to build upon it? There are all sorts of things which could be built upon this information, for example, imaging if the results where given to BHL so that people could search by specimen code.

Thursday, May 14, 2015

The value of ION to GBIF

Ion hdr homeThis a quick writeup of an analysis I did to make the case that the list of names held by the Index of Organism Names (ION) (part of Thomson Reuters) would be very useful for GBIF. I must declare a bias, in that I've spent a good chunk of the last 3-4 years exploring the ION database and investigating ways to link the taxonomic names it contains to the primary taxonomic literature, culminating in building BioNames.

What makes ION special is its scope (it endeavours to have all names covered by the ICZN), and that many of its names have associated citation information (i.e., details on the publication that published the name). Like any name database it has duplications and errors, and some of the older content is a bit ropey, but it's a tremendous resource and from my perspective nothing else in zoology come close.

But rather than rely on anecdote, I decided to do a quick analysis to see what ION could potentially add to GBIF. I've been doing some work on bird names recently, so as an exercise I searched GBIF for holotype specimens for birds. The search (13 May 2015) returned 11,664 records. I then filtered those on taxonomic names that GBIF could not match exactly (TAXON_MATCH_FUZZY) or names that GBIF could only match to a higher rank (TAXON_MATCH_HIGHERRANK). The query URL is:

http://www.gbif.org/occurrence/search?TAXON_KEY=212 &TYPE_STATUS=HOLOTYPE &ISSUE=TAXON_MATCH_FUZZY &ISSUE=TAXON_MATCH_HIGHERRANK

This query found 6,928 records, so over half the bird holotype specimens in GBIF do not match a taxonomic name in GBIF. What this means is that GBIF can't accurately place these names in its own taxonomic hierarchy. It also makes it hard to do meaningful analyses of things such as "how long does it take before a bird specimen is collected to when it is described as a new species?" because if you can match the name then you can't get the date the name was published.

To explore this further, I downloaded the results of the query (the download has DOI http://doi.org/10.15468/dl.vce3ay). I then wrote a script to parse the specimen records and extract the GBIF occurrence id, catalogue number, and scientific name. I then used the GBIF API to retrieve (where available) the verbatim record for each specimen (using the URL http://api.gbif.org/v1/occurrence//verbatim where is the occurrence id). This gives us the original name on the specimen, which I then looked up in BioNames using its API. If I got a hit I extracted the identifier of the name (the LSID in the ION database) and the corresponding publication id in BioNames (if available). If there was a publication associated with the name I then generated a human-readable citation using BioNames’s citeproc API. The code for all this is on github.

Here's a sample of the mapping:

OccurrenceHolotypeGBIF matched nameVerbatim nameIONBioNamesPublicaton
883603238USNM PAL378357.3368464Porzana Vieillot, 1816Porzana severnsi8796592c4f3...
Olson, S. L., & James, H. F. (1991). Descriptions of thirty-two new species of birds from the Hawaiian Islands: Part 1. Non-Passeriformes. Ornithological Monographs, 45, 1-88. doi:10.2307/40166794
858732312AMNH Skin-245914Otus choliba (Vieillot, 1817)Otus choliba duidae4307811b3315...
Chapman, F. M., & History, T. D. E. of the A. M. of N. (1929). Descriptions of new Birds from Mt. Duida, Venezuela. American Museum Novitates, 380, 1-27. Retrieved from http://hdl.handle.net/2246/3988
858732345AMNH Skin-245936Atlapetes Wagler, 1831Atlapetes duidae4307791b3315...
Chapman, F. M., & History, T. D. E. of the A. M. of N. (1929). Descriptions of new Birds from Mt. Duida, Venezuela. American Museum Novitates, 380, 1-27. Retrieved from http://hdl.handle.net/2246/3988
858733764AMNH Skin-45339Leptotila Swainson, 1837Leptotila gaumeri Lawr.
858744126AMNH Skin-218110Zosterops Vigors & Horsfield, 1827Zosterops alberti ablita

The complete result of this mapping can be viewed here. Of the 6,392 holotypes with names not recognised by GBIF, nearly half (3,165, 49.5%) exactly matched a name in ION. Many of these are also linked to the publication that published that name.

So, adding ION help us find half the missing holotype names. This is before doing anything more sophisticated, such as approximate string matching, resolving synonyms, etc. Hence, I'd argue that the names in ION would add a lot to GBIF's ability to interpret the occurrence records it receives from museums.

I've not had time for further analysis, but at first glance a lot of the missed names are subspecies, the are quite a few fossils, and many names are in the relatively older literature. However there are also some recently described taxa, such as the hawk-owl Ninox rumseyi Rasmussen et al. 2012, and a bunting subspecies from Tristan du Cuhna (Nesospiza acunhae fraseri Ryan, 2008) that are missing from GBIF.

Friday, May 08, 2015

Putting some bite into the Bouchout Declaration

There are no requirements for signing up. A signature is first and foremost a statement of support for open data . Each signatory can determine how best to make progress towards the goal. Some recommendations are included in the declaration. We hope that signatories will become early adopters of the open access approach, that they will promote change in their institutions, societies and journals, and will position themselves and their institutions as leaders. (from http://www.bouchoutdeclaration.org/faqs/)
M13QFZi4I've put off writing this post about the Bouchout Declaration for a number of reasons. I attended the meeting that launched the declaration last year, and from my perspective that was a frustrating meeting. Much talk about "Open Biodiversity Knowledge Management" with nobody seemingly willing or able to define it (see The vision thing - it's all about the links for some comments I made before attending the meeting), and as much as the signing of the Boechout Declaration provided good theatre, it struck me as essentially an empty gesture. Public pronouncements are all well and good, but are ultimately of little value unless backed up by action. We have institutions that have signed the declaration yet have much of their intellectual output locked behind paywalls (e.g., JSTOR Global Plants). So much for being open.

So, since Donat challenged me, here's what I'd like to see happen. I'd like to see metrics of "openness" that we can use to evaluate just how open the signatories actually are. These metrics could be viewed as ways to try and persuade institutions into sharing data and other information, as a league table we can use to apply pressure, or as a way to survey the field and see what the impediments are to being open (are they financial, legal, cultural, resource, etc.).

Below are some of the things I think we could "score" the openness of biodiversity institutions.

Is the collection digitised and in GBIF?

Simple criterion that is easy to measure. If an institution has specimens or other biological material, is data and or metadata on the collection freely available? What fraction of the collection has been digitised? How good is that digitsation (e.g., what fraction has been georeferenced?). We could define digitisation more broadly to include imaging and sequencing (both are methods of converting analogue specimens into digital objects).

Are the institutional publications digitised? Are they open access?

Some institutions have a history of digitising their in-house publications and making them freely available online (e.g., the AMNH), some even make them fully citable with CrossRef DOIs (e.g., the Australian Museum). But some institutions have, sadly, signed over their publications to commercial publishers or archives that charge for access (e.g., Kew's publications have been digitised by JSTOR, which limits their accessibility). As a foot note, I suspect that those institutions that lost confidence in their in-house publishing operations and outsourced them are the ones who have ended up loosing control of their intellectual output, some of which is now closed off (e.g., some of the NHM London's journals are now the property of Cambridge University Press). Those institutions that maintained a culture of in-house publishing are the ones at the vanguard of digitising and opening up those publications.

Does the institution take part on the Biodiversity Heritage Library?

There are at least two ways to participate in the Biodiversity Heritage Library (BHL), one is by becoming a member and start scanning books from institutional libraries. The other is by granting permission to BHL to scan institutional publications. BHL is often viewed as an archive of "old" literature, but in fact it has some very recent content. Some farsighted organisations have let BHL scan their journals, contributing to BHL becoming an indispensable resource for biodiversity research.

Do institution staff publish in open access journals?

A while ago I complained about how few new species descriptions were in open access journals (The top-ten new species described in 2010 and the failure of taxonomy to embrace Open Access publication). A measure of openness is whether an institution encourages its staff to publish their work in open access journals, and to make their data freely available as well. Some prefer to chase Nature and Science papers, but I'd like to think we could prioritise openness over journal impact factor.

These are just some of the more obvious things that could be used to measure openness. At the same time, it would be useful to develop ways to show the benefits of being open. For example, I've long argued that we could develop citation tracking for specimens. This gives researchers a means to track provenance of information (who said what about the identity of a specimen), and it also gives institutions a way to measure the impact of their collections. Doing this at scale is only going to be possible if collections are digitised, specimens have identifiers of some sort, and we can text mine the literature and associated data for those identifiers (in other words, the data and publications need to be open). So, perhaps on way to help make the case for being open is to develop metrics that are useful for the institutions themselves.

I guess I would have been much more enthusiastic about the Bouchout Declaration if these sort of things had been in place at the start. Anyone can sign a document. Ideas are cheap, execution is everything.

Tuesday, April 21, 2015

Looking up specimen codes in GBIF using Google Spreadsheet

Playing with the my "material examined" tool I've been working on, I wondered whether I could make use of it in, say, a spreadsheet. Imagine that I have a spreadsheet of museum codes and want to look those up in GBIF. I could create a service for Open Refine but Open Refine is a bit big and clunky, you have to fire up a Java application and point your browser at it, and Open Refine isn't as intuitive or as flexible as a spreadsheet.

It turns that Google Spreadsheets supports custom functions, including importing JSDON from a remote data source. Following How to import JSON data into Google Spreadsheets in less than 5 minutes here's what to do:

  1. Create a new Google Spreadsheet.
  2. Click on Tools -> Script Editor.
  3. Click Create script for Spreadsheet.
  4. Delete the placeholder content and paste the code from this script.
  5. Rename the script to ImportJSON.gs and click the save button.
  6. Back in the spreadsheet, in a cell, you can type “=ImportJSON()” and begin filling out it’s parameters.

Lets imagine we have a spreadsheet with a specimen code in cell A1, e.g. "FMNH 187122".

S1

To call the material examined service, we need a function like this:

=ImportJSON(CONCATENATE("http://bionames.org/~rpage/material-examined/service/api.php?code=",A1,"&match&extend=10"), "/hits/key,/hits/scientificName", "noHeaders")

Paste this into cell B1 (i.e., just to the right of the specimen code) and after a short delay you should see something like this:

S2

The three parameters supplied to ImportJSON are are the query URL, written as a spreadsheet function that grabs the specimen code from cell A1, a list of the bits of data we want to extract from the result (expressed as JSON paths), and some options (in this case, don't show the headers). ImportJSON will grab the specimen code in cell A1, add it to the query URL, then output the results. You should see something like this:

The first column is the GBIF occurrence ID, the second is the scientific name (you can add more JSON paths to get more fields).

Note that we have multiple rows as there is more than one specimen with the code "FMNH 187122" in GBIF. Now, we can ask the material examined service to return only certain taxa (such as mammals) by adding the "scientificName" parameter:

=ImportJSON(CONCATENATE("http://bionames.org/~rpage/material-examined/service/api.php?code=",A10,"&scientificName=",B10,"&match&extend=10"), "/hits/key,/hits/scientificName", "noHeaders")

If you put the specimen code in cell A10, and the higher taxon "Mammalia" in cell B10, and paste the function above into cell C10, then you should see something like this:

S3

Note that now we have a single row with the mammal specimen.

It's a little bit fussy (you need to get the ImportJSON script, and mess a bit with the parameters but it's quick and flexible, and you get all the power of a spreadsheet to help clean the data before trying to match it to GBIF. Plus you can do it all in your browser.

Wednesday, April 15, 2015

GBIF Ebbe Nielsen Challenge finalists announced

The six finalists for the GBIF Ebbe Nielsen Challenge have been announced by GBIF:

“The creativity and ambition displayed by the finalists is inspiring’, said Roderic Page, chair of the Challenge jury and the GBIF Science Committee, who introduced the Challenge at GBIF’s 2014 Science Symposium in October.

“My biggest hope for the Challenge was that the biodiversity community would respond with innovative—even unexpected—entries,” Page said. “My expectations have been exceeded, and the Jury is eager to see what the finalists can achieve between now and the final round of judging.”

The finalists all receive a €1,000 prize, and now have the possibility to refine their work and compete for the grand prize of €20,000 (€5000 for second place). F1F2F3 As the rather cheesy quote above suggests, I think the challenge has been a success in terms of the interest generated, and the quality of the entrants. While the finalists bask in glory, it's worth thinking about the future of the challenge. If it is regarded as a success, should it be run in the same way next year? The first challenge was very open in terms of scope (pretty much anything that used GBIF data), would it be better to target the challenge on a more focussed area? If so, which area needs the nost attention. Food for thought.

Linking specimen codes to GBIF

I've put together a working demo of some code I've been working on to discover GBIF records that correspond to museum specimen codes. The live demo is at http://bionames.org/~rpage/material-examined/ and code is on GitHub.

To use the demo, simply paste in a specimen code (e.g., "MCZ 24351") and click Find and it will do it's best to parse the code, then go off to GBIF and see what it can find. Some examples that are fun include MCZ 24351, KU:IT:00312, MNHN 2003-1054, and AMS I33708-051

Material

It's proof of concept at this stage, and the search is "live", I'm not (yet) storing any results. For now I simply want to explore how well if can find matches in GBIF.

By itself this isn't terribly exciting, but it's a key step towards some of the things I want to do. For example, the NCBI is interested in flagging sequences from type specimens (see http://dx.doi.org/10.1093/nar/gku1127 ), so we could imagine taking lists of type specimens from GBIF and trying to match those to voucher codes in GenBank. I've played a little with this, unfortunately there seem to be lots of cases where GBIF doesn’t know that a specimen is, in fact, a type.

Another thing I’m interested in is cases where GBIF has a georeferenced specimen but GenBank doesn’t (or visa versa), as a stepping stone towards creating geophylogenies. For example, in order to create a geophylogeny for Agnotecous crickets in New Caledonia (see GeoJSON and geophylogenies ) I needed to combine sequence data from NCBI with locality data from GBIF.

It’s becoming increasingly clear to me that the data supplied to GBIF is often horribly out of date compared to what is in the literature. Often all GBIF gets is what has been scribbled in a collection catalogue. By linking GBIF records to specimen codes cited that are cited in the literature we could imagine giving GBIF users enhanced information on a given occurrence (and at the same time get citation counts for specimens The impact of museum collections: one collection ≈ one Nobel Prize).

Lastly, if we can link specimens to sequences and the literature, then we can populate more of the biodiversity knowledge graph

Tuesday, March 10, 2015

GBIF Ebbe Nielsen Challenge submissions: judging begins

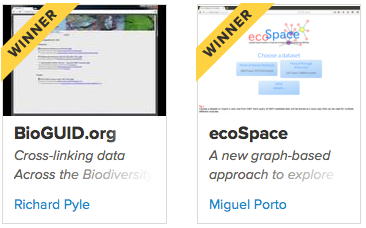
The GBIF Ebbe Nielsen Challenge has closed and we have 23 submissions for the jury to evaluate. There's quite a range of project types (and media, including sound and physical objects), and it's going to be fascinating to evaluate all the entries (some of which are shown below). This is the first time GBIF has run this challenge, so it's gratifying to see so much creativity in response to the challenge. Submissions While judging itself is limited to the jury (of which I'm a member), I'd encourage anyone interested in biodiversity informatics to browse the submissions. Although you can't leave comments directly on the submissions within the GBIF Challenge pages, each submission also appears on the portfolio page of the person/organisation that created the entry, so you can leave comments there (follow the link at the bottom of the page for each submission to see it on the portfolio page).

Friday, February 20, 2015

More examples of data duplication and loss in GBIF: Australian bats in bits

Quick notes on another example of data duplication in GBIF. I'm in the process of building a tool to map specimen codes to GBIF records, and came across the following example. Consider the specimen code "AM M.22320", which is the voucher for the sequence KJ532444 (GenBank gives the voucher as M22320, but the associated paper doi:10.1016/j.ympev.2014.03.009 clarifies that this specimen comes from the Australian Museum). Locating this specimen in GBIF I found a series of records that were identical except for the catalogNumbers, which looked like this: M.22320.001, M.22320.002, etc. What gives?

Initially I thought this may be a simple case of data duplication (maybe the suffixes represent different versions of the same record?). Then I managed to locate the records on the Australian Museum web site:.

  • M.22320.009 - Wet Preparation - Pteralopex taki Parnaby, 2002 - Solomon Islands, 5 km north of Patutiva Village, Marovo Lagoon, New Georgia Island , (8° 31' S , 157° 52' E), 25 Jun 1990 , Holotype
  • M.22320.008 - Skull Preparation - Pteralopex taki Parnaby, 2002 - Solomon Islands, 5 km north of Patutiva Village, Marovo Lagoon, New Georgia Island , (8° 31' S , 157° 52' E), 25 Jun 1990 , Holotype
  • M.22320.001 - Tissue sample - Pteralopex taki Parnaby, 2002 - Solomon Islands, 5 km north of Patutiva Village, Marovo Lagoon, New Georgia Island , (8° 31' S , 157° 52' E), 25 Jun 1990 , Holotype
  • M.22320.005 - Tissue sample - Pteralopex taki Parnaby, 2002 - Solomon Islands, 5 km north of Patutiva Village, Marovo Lagoon, New Georgia Island , (8° 31' S , 157° 52' E), 25 Jun 1990 , Holotype
  • M.22320.006 - Tissue sample - Pteralopex taki Parnaby, 2002 - Solomon Islands, 5 km north of Patutiva Village, Marovo Lagoon, New Georgia Island , (8° 31' S , 157° 52' E), 25 Jun 1990 , Holotype
  • M.22320.007 - Tissue sample - Pteralopex taki Parnaby, 2002 - Solomon Islands, 5 km north of Patutiva Village, Marovo Lagoon, New Georgia Island , (8° 31' S , 157° 52' E), 25 Jun 1990 , Holotype
  • M.22320.003 - Tissue sample - Pteralopex taki Parnaby, 2002 - Solomon Islands, 5 km north of Patutiva Village, Marovo Lagoon, New Georgia Island , (8° 31' S , 157° 52' E), 25 Jun 1990 , Holotype
  • M.22320.004 - Tissue sample - Pteralopex taki Parnaby, 2002 - Solomon Islands, 5 km north of Patutiva Village, Marovo Lagoon, New Georgia Island , (8° 31' S , 157° 52' E), 25 Jun 1990 , Holotype
  • M.22320.002 - Tissue sample - Pteralopex taki Parnaby, 2002 - Solomon Islands, 5 km north of Patutiva Village, Marovo Lagoon, New Georgia Island , (8° 31' S , 157° 52' E), 25 Jun 1990 , Holotype
  • M.22320.010 - Tissue sample - Pteralopex taki Parnaby, 2002 - Solomon Islands, 5 km north of Patutiva Village, Marovo Lagoon, New Georgia Island , (8° 31' S , 157° 52' E), 25 Jun 1990

Turns out we have 10 records for "M.22320", which include various preparations and tissue samples. The holotype specimen for Pteralopex taki (originally described in doi:10.1071/AM01145, see BioNames) has generated 10 different records., all of which have ended up in GBIF. Anyone using GBIF occurrence data and interpreting the number of occurrence records as a measure of how abundant an organism is at a given locality is clearly going to be misled by data like this.

One way to tackle this problem would be if GBIF (or the data provider) could cluster the records that represent the "same" specimen, so GBIF doesn't end up duplicating the same information (in this case, 10-fold). The Australian Museum records don't seem to specify a direct link between the 10 records. I then located the same records in OZCAM, the data provider that feeds GBIF. Here is the OZCAM record for "M.22320.001": http://ozcam.ala.org.au/occurrence/223d1549-1322-419e-8af4-649a4b145064. OZCAM doesn't have the information on whether the record is a skull, a wet preparation, or a tissue sample, that information has been lost, and hence doesn't make it as far as GBIF.

Note that OZCAM has resolvable identifiers for each specimen in the form of UUIDs that are appended to "http://ozcam.ala.org.au/occurrence/". The corresponding UUIDs are included in the Darwin Core dump that OZCAM makes available to GBIF. Here they are for the parts of M.22320:

"223d1549-1322-419e-8af4-649a4b145064","M.22320.001",...
"c40a7eea-6e04-4be6-8dcb-4473402e48c4","M.22320.002",...
"21fcaea1-c645-49d9-9753-dbd9dd2bc64a","M.22320.003",...
"34ffd935-9fb4-44a5-acb8-2cd4df5ade62","M.22320.004",...
"03635fb8-f9ac-4c4c-898b-859cd42f1e26","M.22320.005",...
"a1c4dd5a-dc03-45cc-8971-931c739df8b2","M.22320.006",...
"71c91030-405c-4390-8ec3-42a5478a2fd8","M.22320.007",...
"0f1a9326-34d0-4fb2-b89a-9856bd9082f0","M.22320.008",...
"86270ef7-07f6-4395-84c7-66d5d497cc01","M.22320.009",...

But when GBIF parses the dump it ignores these UUIDs, which means the GBIF user can't easily go to the OZCAM site (which has a bunch of other useful information, compare http://ozcam.ala.org.au/occurrence/223d1549-1322-419e-8af4-649a4b145064 with http://www.gbif.org/occurrence/774916561/verbatim ). It also means that GBIF has stripped out an identifier that we might make use of to unambiguously refer to each record (and, presumably, this UUID doesn't change between harvests of OZCAM data).

In summary, this is a bit of a mess: we have multiple records that are really just bits of the same specimen but which are not linked together by any data provider, and as the data is transmitted up the chain to GBIF clues as to what is going on are stripped out. For a user like me who is trying to link the GenBank sequence to its voucher this is frustrating, and ultimately all rather avoidable if we took just a little more care in how we represent data about specimens, and how we treat that data as it gets transmitted between data bases.

Thursday, February 19, 2015

Post publication review on PubPeer

036e889646a0ff112e5f150a625f5268PubPeer is a web site where people can discuss published articles, anonymously if they prefer. I finally got a chance to play with it a few days, it it was a fascinating experience. You simply type in the DOI or PMID for an article and see if anyone has said anything about that article. It also automatically pulls comments from PubMed Commons, for example the article Putting GenBank data on the map has a comment that was originally published as a guest post on this blog. PubPeer knows about this blog post via Altmetric, which is another nice feature. PubPeer also has browser extensions which, if you install one, automatically flags DOIs on web pages that have comments on PubPeer. Also nice.

So, I took PubPeer for a spin. While browsing GenBank and GBIF, as you do, I came across the following paper: "Conservation genetics of Australasian sailfin lizards: Flagship species threatened by coastal development and insufficient protected area coverage" doi:10.1016/j.biocon.2013.10.014. Some of the sequences from this paper, such as KF874877 are flagged as "UNVERIFIED". Puzzled by this, I raised the issue on PubPeer (see https://pubpeer.com/publications/D1090D7AF8178B1A10C4C45AC1006E ). A little further digging led to the suggestion that they were numts. After raising the issue on Twitter, one of the authors (Cameron Siler) got in touch and reported that there had been an accidental deletion of a single nucleotide in an alignment. Cameron is updating the Dryad data (http://dx.doi.org/10.5061/dryad.1fs7c ) and GenBank sequences.

I like the idea that there is a place we can go to discuss the contents of a paper. It's not controlled by the journal, and you can either identify yourself or remain anonymous if you prefer. Not everyone is a fan of this mode of commentary, especially it is possible for people to make all sorts of accusations while remaining anonymous. But it's a fascinating project, and well worth spending some time browsing around (what IS it with physicists?). For anyone interested in annotating data, it's also a nice example of one possible approach.

Wednesday, January 28, 2015

Annotating GBIF, from datasets to nanopublications

Below I sketch what I believe is a straightforward way GBIF could tackle the issue of annotating and cleaning its data. It continues a series of posts Annotating GBIF: some thoughts, Rethinking annotating biodiversity data, and More on annotating biodiversity data: beyond sticky notes and wikis on this topic.

Let's simplify things a little and state that GBIF at present is essentially an aggregation of Darwin Core Archive files. These are for the most part simply CSV tables (spreadsheets) with some associated administrivia (AKA metadata). GBIF consumes Darwin Core Archives, does some post-processing to clean things up a little, then indexes the contents on key fields such as catalogue number, taxon name, and geographic coordinates.

What I'm proposing is that we make use of this infrastructure, in that any annotation is itself a Darwin Core Archive file that GBIF ingests. I envisage three typical use cases:

  1. A user downloads some GBIF data, cleans it for their purposes (e.g., by updating taxonomic names, adding some georeferencing, etc.) then uploads the edited data to GBIF as a Darwin Core Archive. This edited file gets a DOI (unless the user has go one already, say by storing the data in a digital archive like Zenodo).
  2. A user takes some GBIF data and enhances it by adding links to, for example, sequences in GenBank for which the GBIF occurrences are voucher specimens, or references which cite those occurrences. The enhanced data set is uploaded to GBIF as a Darwin Core Archive and, as above, gets a DOI.
  3. A user edits an individual GBIf record, say using an interface like this. The result is stored as a Darwin Core Archive with a single row (corresponding to the edit occurrence), and gets a DOI (this is a nanopublication, of which more later)

Note that I'm ignoring the other type of annotation, which is to simply say "there is a problem with this record". This annotation doesn't add data, but instead flags an issue. GBIF has a mechanism for doing this already, albeit one that is deeply unsatisfactory and isn't integrated with the portal (you can't tell whether anyone has raised an issue for a record).

Note also that at this stage we've done nothing that GBIF doesn't already do, or isn't about to do (e.g., minting DOIs for datasets). Now, there is one inevitable consequence of this approach, namely that we will have more than one record for the same occurrence, the original one in GBIF, and the edited record. But, we are in this situation already. GBIF has duplicate records, lots of them.

Duplication

As an example, consider the following two occurrences for Psilogramma menephron:

occurrencetaxonlongitudelatitudecatalogue numbersequence
887386322Psilogramma menephron Cramer, 1780145.86301-17.44BC ZSM Lep 01337
1009633027Psilogramma menephron Cramer, 1780145.86-17.44KJ168695KJ168695

These two occurrences come from the Zoologische Staatssammlung Muenchen - International Barcode of Life (iBOL) - Barcode of Life Project Specimen Data and Geographically tagged INSDC sequences data sets, respectively. They are for the same occurrence (you can verify this by looking at the metadata data for the sequence KJ168695 where the specimen_voucher field is "BC ZSM Lep 01337").

What do we do about this? One approach would be to group all such occurrences into clusters that represent the same thing. We are then in a position to do some interesting things, such as compare different estimates of the same values. In the example above, there is clearly a difference in precision of geographic locality between the two datasets. There are some nice techniques available for synthesising multiple estimates of the same value (e.g., Bayesian belief networks), so we could provide for each cluster a summary of the possible values for each field. We can also use these methods to build up a picture of the reliability of different sources of annotation.

In a sense, we can regard one record (1009633027) as adding an annotation to the other (887386322), namely adding the DNA sequence KJ168695 (in Darwin Core parlance, "associatedSequences=[KJ168695]").

But the key point here is that GBIF will have to at some point address the issue of massive duplication of data, and in doing so it will create an opportunity to solve the annotation problem as well.

Github and DOIs

In terms of practicalities, it's worth noting that we could use github to manage editing GBIF data, as I've explored in GBIF and Github: fixing broken Darwin Core Archives. Although github might not be ideal (there some very cool alternatives being developed, such as dat, see also interview with Max Ogden) it has the nice feature that you can publish a release and get a DOI via its integration with Zenodo. So people can work on datasets and create citable identifiers at the same time.

Nanopublications

If we consider that a Darwin Core Archive is basically a set of rows of data, then the minimal unit is a single row (corresponding to a single occurrence). This is the level at which some users will operate. They will see an error in GBIF and be able to edit the record (e.g., by adding georeferencing, an identification, etc.). One challenge is how to create incentives for doing this. One approach is to think in terms of nanopublications, which are:
A nanopublication is the smallest unit of publishable information: an assertion about anything that can be uniquely identified and attributed to its author.
A nanopublication comprises three elements:
  1. The assertion: In this context the Darwin Core record would be the assertion. It might be a minimal record in that, say, it only listed the fields relevant to the annotation.
  2. The provenance: the evidence for the assertion. This might be the DOI of a publication that supports the annotation.
  3. The publication information: metadata for the nanopublication, including a way to cite the nanopublication (such as a DOI), and information on the author of the nanopublication. For example, the ORCID of the person annotating the GBIF record.

As an example, consider GBIF occurrence 668534424 for specimen FMNH 235034, which according to GBIF is a specimen of Rhacophorus reinwardtii. In a recent paper

Matsui, M., Shimada, T., & Sudin, A. (2013, August). A New Gliding Frog of the Genus Rhacophorus from Borneo . Current Herpetology. Herpetological Society of Japan. doi:10.5358/hsj.32.112
Matsui et al. assert that FMNH 235034 is actually Rhacophorus borneensis based on a phylogenetic analysis of a sequence (GQ204713) derived from that specimen. In which case, we could have something like this:

The nanopublication standard is evolving, and has a lot of RDF baggage that we'd need to simplify to make fit the Darwin Core model of a flat row of data, but you could imagine having a nanopublication which is a Darwin Core Archive that includes the provenance and publication information, and gets a citable identifier so that the person who created the nanopublication (in the example above I am the author of the nanopublication) can get credit for the work involved in creating the annotation. Using citable DOIs and ORCIDs to identify the nanpublication and its author embeds the nanopublication in the wider citation graph.

Note that nanopublications are not really any different from larger datasets, indeed we can think of a dataset of, say, 1000 rows as simply an aggregation of nanopublications. However, one difference is that I think GBIF would have to setup the infrastructure to manage the creation of nanopublications (which is basically collect user's input, add user id, save and mint DOI). Whereas users working with large datasets may well be happy to work with those on, say github or some other data editing environment, people willing to edit single records are unlikely to want to mess with that complexity.

What about the original providers?

Under this model, the original data provider's contribution to GBIF isn't touched. If a user adds an annotation that amounts to adding a copy of the record, with some differences (corresponding to the user's edits). Now, the data provider may chose to accept those edits, in which case they can edit their own database using whatever system they have in place, and then the next time GBIF re-harvests the data, the original record in GBIF gets updated with the new data (this assumes that data providers have stable ids for their records). Under this approach we free ourselves from thinking about complicated messaging protocols between providers and aggregators, and we also free ourselves from having to wait until an edit is "approved" by a provider. Any annotation is available instantly.

Summary

My goal here is to sketch out what I think is a straightforward way to tackle annotation that makes use of what GBIF is already doing (aggregating Darwin Core Archives) or will have to do real soon now (cluster duplicates). The annotated and cleaned data can, of course, live anywhere (and I'm suggesting that it could live on github and be archived on Zenodo), so people who clean and edit data are not simply doing it for the good of GBIF, they are creating data sets that can be used independently and be cited independently. Likewise, even if somebody goes to the trouble of fixing a single record in GBIF, they get a citable unit of work that will be linked to their academic profile (via ORCD).

Another aspect of this approach is that we don't actually need to wait for GBIF to do this. If we adopt Darwin Core Archive as the format for annotations, we can create annotations, mint DOIs, and build our own database of annotated data, with a view to being able to move that work to GBIF if and when GBIF is ready.

Thursday, January 22, 2015

GeoJSON and geophylogenies

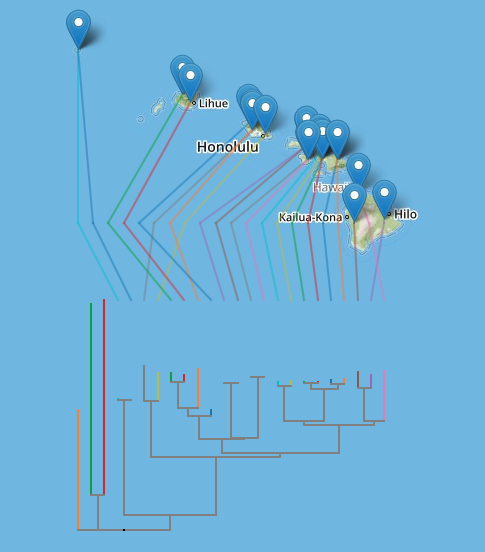
For the last few weeks I've been working on a little project to display phylogenies on web-based maps such as OpenStreetMap and Google Maps. Below I'll sketch out the rationale, but if you're in a hurry you can see a live demo here: http://iphylo.org/~rpage/geojson-phylogeny-demo/, and some examples below.

The first is the well-known example of Banza katydids from doi:10.1016/j.ympev.2006.04.006, which I used in 2007 when playing with Google Earth.

Banza

The second example shows DNA barcodes similar to ABFG379-10 for Proechimys guyannensis and its relatives.

Barcode

Background

People have been putting phylogenies on computer-based maps for a while, but in most cases these have required stand-alone software, such as Google Earth, or GeoJSON for encoding geographic information. Despite the obvious appeal of placing trees in maps, and calls for large-scale geophylogeny databases (e.g., do:10.1093/sysbio/syq043), computerised drawing trees on maps has remained a bit of a niche activity. I think there are several reasons for this:

  1. Drawing trees on maps needs both a tree and geographic localities for the nodes in the tree. The later are not always readily available, or may be in different databases to the source of phylogenetic data.
  2. There's no accepted standard for encoding geographic information associated with the leaves in a tree, so everyone pretty much invents their own format.
  3. To draw the tree we typically need standalone software. This means users have to download software, instead of work on the web (which is where all the data is).
  4. Geographic formats such as KML (used by Google Earth) are not particularly easy to store and index in databases.

So there are a number of obstacles to making this easy. The increasing availability of geotagged sequences in GenBank (see Guest post: response to "Putting GenBank Data on the Map"), especially DNA barcodes, helps. For the demo I created a simple pipeline to take a DNA barcode, query BOLD for similar sequences, retrieve those, align them, build a neighbour joining tree, annotate the tree with latitude and longitudes, and encode that information in a NEXUS file.

To layout the tree on a map (say OpenStreetMap using Leaflet or Google Maps) I convert the NEXUS file to GeoJSON. There are a couple of problems to solve when doing this.Typically when drawing a phylogeny we compute x and y coordinates for a device such as a computer screen or printer where these coordinates have equal units and are linear in both horizontal and vertical dimensions. In web maps coordinates are expressed in terms of latitude and longitude, and in the widely-used Web Mercator projection the vertical axis (latitude) is non-linear. Furthermore, on a web map the user can zoom in and out, so pixel-based coordinates only make sense with respect to a given zoom level.

To tackle this I compute the layout of the tree in pixels at zoom level 0, when the web map comprises a single "tile".

Tile

The tile coordinates are then converted to latitude and longitude, so that they can be placed on the map. The map applications take care of zooming in and out, so the tree scales appropriately. The actual sampling localities are simply markers on the map. Another problem is to reduce the visual clutter that results from criss-crossing lines connecting connecting the tips of the tree and the associated sampling localities. To make the diagram more comprehensible, I adopt the approach used by GenGIS to reorder the nodes in the tree to minimise the crossings (see algorithm in doi:10.7155/jgaa.00088). The tree and the lines connecting it to the localities are encoded as "LineString" objects in the GeoJSON file.

There are a couple of things which could be done with this kind of tool. The first is to add it as a visualisation to a set of phylogenies or occurrence data. For example, imagine my "million barcode map" having the ability to display a geophylogeny for any barcode you click on.

Another use would be to create a geographically indexed database of phylogenies. There are databases such as CouchDB that store JSON as a native format, and it would be fairly straightforward to consume GeoJSON for a geophylogeny, ignore the bits that draw the tree on the map, and index the localities. We could then search for trees in a given region, and render them on a map.

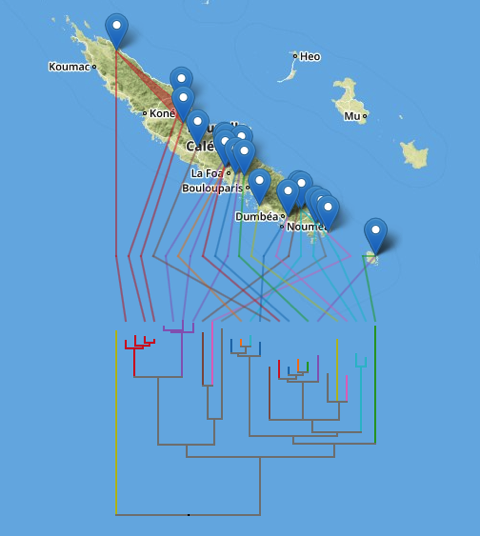
There's still some work to do (I need to make the orientation of the tree optional and there are some edges case that need to be handled), but it's starting to reach the point when it's fun just to explore some examples, such as these microendemic Agnotecous crickets in New Caledonia (data from doi:10.1371/journal.pone.0048047 and GBIF).

Cricket

Tuesday, January 20, 2015

Bitcoin, Xanadu, Ted Nelson, and the web that wasn't

A couple of articles in the tech press got me thinking this morning about Bitcoin, Ted Nelson, Xanadu, and the web that wasn't. The articles are After The Social Web, Here Comes The Trust Web and Transforming the web into a HTTPA 'database'. There are some really interesting ideas being explored based on centralised tracking of resources (including money, think Bitcoin, and other assets, think content). I wonder whether these developments may make lead to renewed interest in some of the ideas of Ted Nelson.

I've always had a soft-spot for Ted Nelson and his Xanadu project (see my earlier posts on translcusion and Nature's ENCODE app). To get a sense of what he was after, we can compare the web we have with what Nelson envisaged.

The web we have today:

  1. Links are one-way, in that it's easy to link to a site (just use the URL), but it's hard for the target site to find out who links to it. Put another way, like writing a scientific paper, it's easy to cite another paper, but non-trivial to find out who is citing your own work.
  2. Links to another document are simply launching pads to go to that other document, whether it's still there or not.
  3. Content is typically either "free" (paid for by advertising or in exchange for personal data), or behind a paywall and hence expensive.

Nelson wanted:

  1. Links that were bidirectional (so not only did you get cited, but you knew who was citing you)
  2. "Transclusion", where documents would not simply link (=cite) to other documents but would include snippets of those documents. If you cited another document, say to support a claim, you would actually include the relevant fragment of that document in your own document.
  3. A micropayment system so that if your work was "transcluded" you could get paid for that content.

The web we have is in many ways much easier to build, so Nelson's vision lost out. One-way links are easy to create (just paste in a URL), and the 404 error (that you get when a web page is missing) makes it robust to failure. If a page vanishes, things don't collapse, you just backtrack and go somewhere else.

Nelson had a more tightly linked web. He wanted to keep track of who links to whom automatically. Doing this today is the preserve of big operations such as Google (who count links to rank search results) or the Web of Science (who count citations to rank articles and journals - note that I'm using the web and the citation network pretty much interchangeably in this post). Because citation tracking isn't built into the web, you need create this feature, and that costs money (and hence nobody provides access to citation data for free).

In the current web, stuff (content) is either given away for "free" (or simply copied and pasted as if it was free), or locked behind paywalls. Free, of course, is never free. We are either handing over data, being the targets of advertising (better targeted the more data we hand over), or we pay for freedom directly (e.g., open access publication fees in the case of scientific articles). Alternatively, we have the paywalls well know to academics, where much of the world's knowledge is held behind expensive paywalls (in part because publishers need some way to make money, and there's little middle ground between free and expensive).

Nelson's model envisaged micropayments, where content creators would get small payments every time their content was used. Under the transclusion model, only small bits of your content might be used (in the context of a scientific paper, imagine just a single fact or statement was used). You didn't get everything for free (that would destroy the incentive to create), but nor was everything locked up behind prohibitively expensive paywalls. Nelson's model never took off, in part I suspect because there was simply no way to (a) track who was using the content, and (b) collect micropayments.

What is interesting is that Bitcoin seems to deal with the micropayments issue, and the HTTPA protocol (which uses much the same idea as Bitcoin to keep an audit trail of who has accessed and used data) may provide a mechanism to track usage. How is this going to change the current web? Might there be ways to use these ideas to reimagine academic publishing, which at the moment seems caught between steep open access fees or expensive journal subscriptions?

Friday, January 09, 2015

GBIF, biodiversity informatics and the "platform rant"

Each year about this time, as I ponder what to devote my time on in the coming year, I get exasperated and frustrated that each year will be like the previous one, and biodiversity informatics will seem no closer to getting its act together. Sure, we are putting more and more data online, but we are no closer to linking this stuff together, or building things that people can use to do cool science with. And each year I try and figure out why we are still flaying about and not getting very far. This year, I've settled on the lack of "platforms".

In 2011 Steve Yegge (accidentally) published a widely read document known as the "Google Platforms Rant". It's become something of a classic, and I wonder if biodiversity informatics can learn from this rant (it's long but well worth a read).

One way to think about this is to look at how we build things. In the early days, people would have some data and build a web site:

Rant1

In the diagram above "dev" is the web developer who builds the site, and "DBA" is the person who manages the data (for many projects this is one and the same person). The user is presented with a web site, and that's the only way they can access the data. If the web site is well designed this typically works OK, but the user will come up against limitations. Why do I have to manually search for each record? How can I combine this data with some other data? These questions lead to some users doing things like screen scrapping, anything to get the data and do more than the web site permits (I spend a lot of my time doing exactly this). In contrast, the person (or team) building the site ("dev") can access the data and tools directly.

Eventually some sites realise that they could add value to their users if they added an API, so typically we get something like this:

Rant2

Now we have an API (yay), but notice that it is completely separate from the web site. Now the site developers have to manage two different things, and two sets of users (web site visitors, and user programming against the API). Because the site and the API are different, and the site gets more users, typically what happens is the API lacks much of the functionality of the site, which frustrates users of the API. For example, when Mendeley launched it's API its limited functionality and lack of documentation drove me nuts. Similarly, the Encyclopedia of Life (EOL) API is pretty sucky. If anyone from EOL is reading this, for the love of God add user authentication and the ability to create and edit collections to the API. Until you do, you'll never have an ecosystem of apps.

A solution to sucky APIs is "dogfooding":

Rant3

Dogfooding is the idea that your product is so good you'd use it yourself. In the case of web development, if we build the web site on top of the same API that we expose to users, then the site developers have a strong incentive to make the API well-documented and robust, because their web site runs on the same services. As a result the interests of the web developers and users who are programmers are much more aligned. If a user finds a bug in the API, or the API lacks a feature, it's much more likely to get fixed. An example of a biodiversity informatics project that "gets" dogfooding is GBIF, which has a nice API that powers much of their web site. This is a good example of how to tell if an API is any good, namely, can you recreate the web site yourself just using the API?

But the example above leaves one aspect of the whole system still intact and not accessible to users. Typically a company or organisation has data, tools, and processes that it uses to manage whatever is central to its operations. These are kept separate from users, who only get to access these indirectly through the web site or the API.

A "platform" takes things one step further. Steve Yegge summarises Jeff Bezos' memo that outlined Amazon's move to a platform:

  1. All teams will henceforth expose their data and functionality through service interfaces.
  2. Teams must communicate with each other through these interfaces.
  3. There will be no other form of interprocess communication allowed: no direct linking, no direct reads of another team's data store, no shared-memory model, no back-doors whatsoever. The only communication allowed is via service interface calls over the network.
  4. It doesn't matter what technology they use. HTTP, Corba, Pubsub, custom protocols -- doesn't matter. Bezos doesn't care.
  5. All service interfaces, without exception, must be designed from the ground up to be externalizable. That is to say, the team must plan and design to be able to expose the interface to developers in the outside world. No exceptions.
  6. Anyone who doesn't do this will be fired.
  7. Thank you; have a nice day!
All the core bits of infrastructure that powered Amazon were to become services, and different bits of Amazon could only talk to each other through these services. The point of this is that it enabled Amazon to expose its infrastructure to the outside world (AKA paying customers) and now we have Amazon cloud services for storing data, running compute jobs, and so on. By exposing its infrastructure as services, Amazon now runs a big chunk of the startup economy. By insisting that Amazon itself uses these services (dogfooding at the infrastructure level), Amazon ensures that this infrastructure works (because its own business depends on it).

Rant4

There are some things Google does that are like a platform (despite the complaints in the "Google Platforms Rant"). For example, you could imagine that most workers at Google use tools such as Google Docs to create and share documents. Likewise, Google Scholar is unlikely to be a simple act of altruism. If you have a team of world class researchers you need a tool that enables them to find existing research. Google Scholar does this. If you then expose it to the outside world you get more users, and an incentive for commercial publishers to open up their paywall journals to being indexed by Google's crawlers, and incentive that would be missing if Scholar was purely an internal service.

Now, giant companies like Amazon and Google might seem a world away from biodiversity informatics, but I think there are things we can learn from this. Looking around, I think there are other examples of platforms that may seem closer to home. For example, the NCBI runs GenBank and PubMed, and these are very like platforms. GenBank provides tools, such as BLAST, that it provides to the user community, but which it also uses internally to cluster sequences into related sets. Consider PubMed, which has gone from a simple index to the biomedical literature to a publishing platform. PubMed has driven the standardisation of XML across biomedical publishers. It is quite possible to visit the NCBI site, explore data, then read full text for the associated publications in PubMed Central, without ever leaving the NCBI site. No wonder some commercial publishers are deeply worried about PubMed Central.

A key thing about platforms is that the people running the platform have a deep interest in many of the same things as the users of that platform (note the "users" scattered all over the platform diagram above). Instead of user being a separate category that you try and serve by figuring out what they want, developers are users too.

To try and flesh this out a little more, what would a "taxonomic" platform look like? At the moment, we have lots of taxonomic web sites that pump out lists of names and little else. This is not terribly useful. If we think about what goes into making lists of names, it requires access to the scientific literature, it requires being able to read that literature and extract statements about names (e.g., this is the original description, these two names are synonyms, etc.), and it requires some way of summarising what we know about those names and the taxa that we label with those names. Typically these are all things that happen behind the scenes, then the user simply gets a list of names. A platform would expose all of the data, tools, and processes that went into making that list. It would provide the literature in both human and computer readable forms, it would provide tools for extracting information, tools to store knowledge about those names, and tools to make inferences using that knowledge. All of these would be exposed to users. And these some services and tools would be used by the people building those services and tools.

This last point means that you also need people working on the same problems as "users". For example, consider something like GBIF. At the moment GBIF consumes output of taxonomic research (such as lists of names) and tries to make sense of these before serving them back to the community. There is little alignment between the interests of taxonomists and GBIF itself. For GBIF to become a taxonomic platform, it would need to provide the data, tools and services for people to do taxonomic research, and ideally it would actually have taxonomists working at GBIF using those tools (these taxonomists could, for example, be visiting fellows working on particular taxa, rather than permanent employees). These tools would greatly help the taxonomic community, but also help GBIF make sense of the millions of names it has to interpret.

It's important to note here the the goal of the platform is NOT to "help" users - that simply reinforces the distinction between you and the "users". Instead it is to become a user. You may have more resources, and work on a different scale (few business Amazon's services support will be anything like as big as Amazon), but you are ultimately "just" another user.