I keep returning to the problem of viewing large graphs and trees, which means my hard drive has accumulated lots of failed prototypes. Inspired by some recent discussions on comparing taxonomic classifications I decided to package one of these (wildly incomplete) prototypes up so that I can document the idea and put the code somewhere safe.
Very cool, thanks for sharing this-- the tree diff is similar to what J Rees has been cooking up lately with his 'cl diff' tool. I'll tag @beckettws in here too so he can see potential crossover. The goal is autogenerate diffs like this as 1st step to mapping taxo name-to concept
— Nate Upham (@n8_upham) December 28, 2021
Google Maps-like viewer
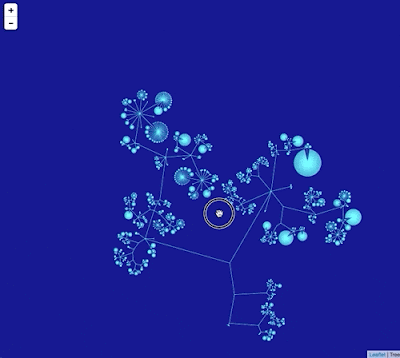
I've created a simple viewer that uses a tiled map viewer (like Google Maps) to display a large graph. The idea is to draw the entire graph scaled to a 256 x 256 pixel tile. The graph is stored in a database that supports geospatial queries, which means the queries to retrieve the individual tiles need to display the graph at different levels of resolution are simply bounding box queries to a database. I realise that this description is cryptic at best. The GitHub repository https://github.com/rdmpage/gml-viewer has more details and the code itself. There's a lot to do, especially adding support for labels(!) which presents some interesting challenges (levels of detail and generalization). The code doesn't do any layout of the graph itself, instead I've used the yEd tool to compute the x,y coordinates of the graph.
Since this exercise was inspired by a discussion of the ASM Mammal Diversity Database, the graph I've used for the demonstration above is the ASM classification of extant mammals. I guess I need to solve the labelling issue fairly quickly!