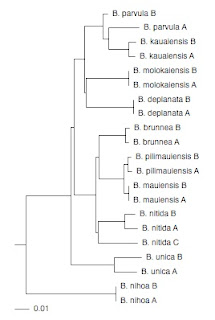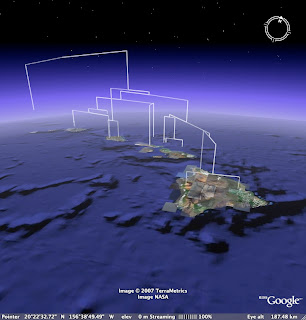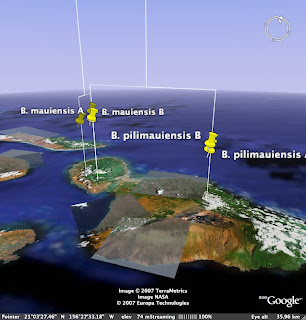
As an example, I've taken a phylogeny for Banza katydids from Shapiro et al. (doi:10.1016/j.ympev.2006.04.006), and created a KML file. Unlike Bill's trees, I've drawn the tree as a phylogram, because I think biogeography becomes much easier to interpret when we have a time scale (or at least a proxy, such as sequence divergence).

I've converted COI branch lengths to altitude, and elevated the tree off the ground to accomodate the fact that the tips don't all line up (this isn't an ultrametric tree). I then use the extrude style of icon so we can see where exactly the sequence was obtained from.

Wouldn't it be fun to have a collection of molecular trees for Hawaiian taxa for the same gene, plotted on the same Google Earth map? One could imagine all sorts of cool questions one could ask about the kinds of biogeographic patterns displayed (note that Banza doesn't show a simple west-east progression), and the ages of the patterns.
Generating the KML file is fairly straightforward, and if I get time I may add it to my long neglected TreeView X.
Very nice, I like this vis a lot. I can see some clear benefits for this approach. So the height of the extruded icon is now the true branch terminus?
ReplyDelete
ReplyDeleteGenerating the KML file is fairly straightforward, and if I get time I may add it to my long neglected TreeView X.
Yes please!
This would be perfect for a paper I'm working on right now.
--Simon
Now that's a cool use for Google Earth.
ReplyDeleteWhat did you use to generate the KML file?
Gee, I step away from the computer for a moment...
ReplyDeleteAndrew, where the icon sits is indeed the terminus. I haven't spent much time thinking about how to make this bullet proof (for example, ensuring that none of the icons end up inside the terrain), nor how to pick the mean height above the surface, but these are things that would be fairly straightforwrad to address.
Keesey, I used a C++ program that uses a lot of code from TreeView X. I'm looking at either releasing a command line version, or building it into TreeView X itself (which means a bit more work to have a GUI to read in geographical coordinates).
Simon, well it's not ready for prime time, but if you send me a Newick or NEXUS file and a list of latitudes and longitudes for each leaf of the tree, I could try and construct an example for you.
That is a very cool example of data visualization. In one picture you get geography and sequence divergence. Nice :).
ReplyDeleteI second (and third, and fourth...) what Simon said, and am prepared to offer alcoholic beverages in support of same.
ReplyDeleteJust for those interested, KML generation has meanwhile been added to GeoPhylobuilder, BTW. GeoPhylobuilder is open-source, and available for download from informatics.nescent.org (Software). There's also information at http://evoviz.nescent.org/GeoPhyloBuilder.
ReplyDeleteGeoPhyloBuilder looks cool, although it is Windows only, and unless I'm mistaken requires ESRI's ArcGIS(?)
ReplyDeleteIt is Windows-only indeed. It also does require ESRI's ArcGIS, but whenever I mention that I am muzzled with the comment that virtually every university has a campus license for ArcGIS (if that's not true at all I'd be glad to know as ammunition :-)
ReplyDeleteWe've been tossing around ideas here for whether and how to turn this into a web-service. In essence, the ArcGIS add-on in the end creates a bunch of files, which are then passed off to and read by ArcView. You could as well receive those files as the downloadable result from a web-service, or a web-page that encapsulates it. Not quite as nice as directly integrated into ArcGIS, but not that bad either, I would think.
Feel free to weigh in on those considerations, as we're trying to gauge community "value" of this versus other feature additions (and David is full of ideas).
GIS and Google Earth perform very different functions and thus should not be regarded as competing but instead complementary alternatives. GIS provides a high end customizable database, visualization and analysis environment, in contrast, Google Earth is a excellent freely accessible global browser. While in principle I support free open access software the reality is that software development is usually much slower. Many research organizations in the developed world have site GIS licenses while the number in developing world is increasing; access to licenses however remains a problem. Open source GIS are developing fast especially in the realm of Internet map services so perhaps in a few years the situation will be more favorable. As an analogy do we make our own DNA sequencers or refuse to use Microsoft or Apple products because they are commercial products? (Yes I know some do, but not as many as complain without acting).
ReplyDeleteHaving had my short rant I fully endorse setting up an Internet service for GeoPhyloBuilder so people without ArcGIS licenses can create KML and 3D-shapefiles that can be viewed and analyzed in Google Earth, R or any other package that can read these formats. We also hope to add support for reticulate network models and hence develop a generic GIS datamodel for spatial evolutionary data and models.